2024.11.25
- Features
-
Services/ProductsServices/ProductsServices/Products

Learn more about the retail trading conditions, platforms, and products available for trading that FXON offers as a currency broker.
You can't start without it.
Trading Platforms Trading Platforms Trading Platforms
Features and functionality comparison of MetaTrader 4/5, and correspondence table of each function by OS
Two account types to choose
Trading Account Types Trading Account Types Trading Account Types
Introducing FXON's Standard and Elite accounts.
close close

-
SupportSupportSupport

Support information for customers, including how to open an account, how to use the trading tools, and a collection of QAs from the help desk.
Recommended for beginner!
Account Opening Account Opening Account Opening
Detailed explanation of everything from how to open a real account to the deposit process.
MetaTrader4/5 User Guide MetaTrader4/5 User Guide MetaTrader4/5 User Guide
The most detailed explanation of how to install and operate MetaTrader anywhere.
FAQ FAQ FAQ
Do you have a question? All the answers are here.
Coming Soon
Glossary Glossary GlossaryGlossary of terms related to trading and investing in general, including FX, virtual currencies and CFDs.
News News News
Company and License Company and License Company and License
Sitemap Sitemap Sitemap
Contact Us Contact Us Contact Us
General, personal information and privacy inquiries.
close close

- Promotion
- Trader's Market
- Partner
-
close close
Learn more about the retail trading conditions, platforms, and products available for trading that FXON offers as a currency broker.
You can't start without it.
Features and functionality comparison of MetaTrader 4/5, and correspondence table of each function by OS
Two account types to choose
Introducing FXON's Standard and Elite accounts.
Support information for customers, including how to open an account, how to use the trading tools, and a collection of QAs from the help desk.
Recommended for beginner!
Detailed explanation of everything from how to open a real account to the deposit process.
The most detailed explanation of how to install and operate MetaTrader anywhere.
Do you have a question? All the answers are here.
Coming Soon
Glossary of terms related to trading and investing in general, including FX, virtual currencies and CFDs.
General, personal information and privacy inquiries.
Useful information for trading and market information is posted here. You can also view trader-to-trader trading performance portfolios.
Find a trading buddy!
Share trading results among traders. Share operational results and trading methods.
- Legal Documents TOP
- Client Agreement
- Risk Disclosure and Warning Notice
- Order and Execution Policy
- Complaints Procedure Policy
- AML/CFT and KYC Policy
- Privacy Policy
- eKYC Usage Policy
- Cookies Policy
- Website Access and Usage Policy
- Introducer Agreement
- Business Partner Agreement
- VPS Service Terms and Condition

This article was :
published
updated
Weekly FX Market Review and Key Points for the Week Ahead
The dollar remained strong in the trading week ending on November 24th. However, the situation in Ukraine and economic indicators caused volatility in the market. The USDJPY fluctuated wildly between 153 yen and just under 156 yen. Meanwhile, the EURUSD and GBPUSD fell sharply due to active dollar buying.
Let's review the market movements for the week.
November 18 (Mon)
The USDJPY opened the week's trading session at the lower 154 yen range and then rallied to the 155 yen range. However, the continued dollar buying from the previous week came to a halt as the market became aware of resistance at higher levels.
With no news to influence the market, traders took a somewhat corrective stance.
November 19 (Tue)
Traders took a risk-off stance after Russian President Vladimir Putin issued a new nuclear doctrine that lowered the threshold for using nuclear arsenals. The USDJPY fell to the lower 153 yen range before the dollar buyback lifted the pair back to the 154 yen range, only to have a limited rebound.
Meanwhile, the Eurozone's revised Harmonized Index of Consumer Prices (HICP) for October met expectations, registering an increase of 2.0% year-on-year. The HICP core for the same month was also in line with expectations, registering an increase of 2.7% year-on-year.
November 20 (Wed)
The continuous rise in U.S. long-term interest rates spurred dollar buying, and the USDJPY hit the upper 155 yen range. However, after it was reported that the Ukrainian military used long-range missiles provided by the U.K. to attack Russian territory, risk-off sentiment reignited, and the USDJPY fell.
The strong dollar pushed the EURUSD down to the 1.05 range. The GBPUSD followed suit, falling to the 1.26 range.
November 21 (Thu)
Media reports that Russia had launched an intercontinental ballistic missile (ICBM) raised tensions in the market. The USDJPY fell to the upper 153 yen range as risk-off traders bought yen. However, the pair later rebounded to the upper 154 yen range.
The EURUSD broke below its recent low to fall to the 1.04 range. The GBPUSD also fell to the 1.25 range.
November 22 (Fri)
Japan's Consumer Price Index (CPI) for October, which slowed from September's 2.5% year-on-year increase, matched expectations for a 2.3% year-on-year increase. On the other hand, the CPI core, which excludes fresh food, beat expectations slightly, registering an increase of 2.3% year-on-year. These figures reduced the likelihood of a December rate hike by the Bank of Japan. After the USDJPY briefly dipped below 154 yen, the steady performance of the Nikkei 225 lifted the pair into the upper 154 yen range. However, the market had no clear direction.
Meanwhile, the disappointing Eurozone PMI pushed the EURUSD down to the 1.03 range. The GBPUSD also fell to the 1.24 range during the day.
Economic Indicators and Statements to Watch this Week
(All times are in GMT)
November 26 (Tue)
15:00 U.S.: October New Residential Sales
19:00 U.S.: Minutes of the Federal Open Market Committee (FOMC)
November 27 (Wed)
13:30 U.S.: July-September quarterly real gross domestic product (revised GDP)
15:00 U.S.: October personal consumption expenditures (PCE core deflator)
15:00 U.S.: October personal consumption expenditures (PCE core deflator, excluding food and energy)
November 29 (Fri)
10:00 Europe: November Harmonised Index of Consumer Prices (preliminary HICP index)
10:00 Europe: November Harmonised Index of Consumer Prices (preliminary HICP core index)
This Week's Forecast
The following currency pair charts are analyzed using an overlay of the ±1 and ±2 standard deviation Bollinger Bands, with a period of 20 days.
USDJPY
Rising geopolitical risk, led by the escalating situation in Ukraine, is clouding the market. As the U.S. market will be closed on November 28th for the Thanksgiving holiday, liquidity is expected to decrease towards the weekend.
In addition, it is necessary to pay attention to market movements in advance of the release of the FOMC meeting minutes on November 27th.
Next is an analysis of the USDJPY daily chart.
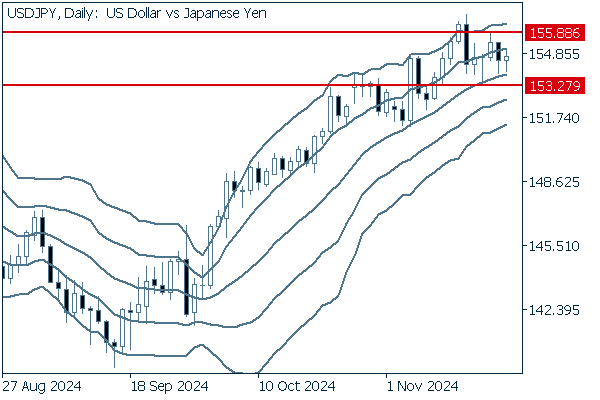

The middle line maintains its upward direction. However, candlesticks over the past week show a lack of direction. The pair has failed to break above a recent high or below a recent low. The uptrend will likely continue. However, if it breaks below 153.27 yen, the low of the week of November 11th, a downward trend may occur.
We continue with an analysis of the USDJPY weekly chart.
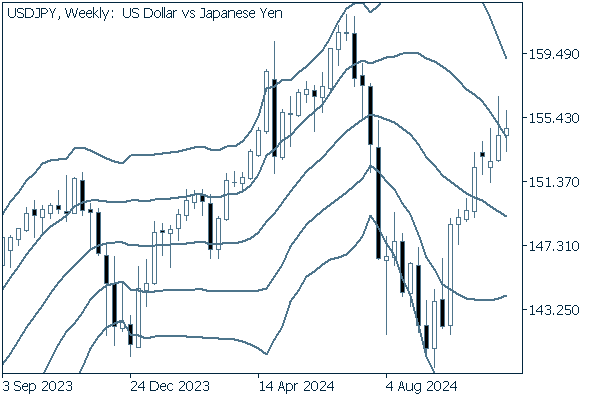

On the weekly chart, three consecutive positive candlesticks have been formed. However, during the week of November 18th, the pair failed to break above the previous week's high or below the previous week's low. As the middle line remains downward, it is better to consider the possible downtrend.
EURUSD
The weaker-than-expected German, French, and Eurozone PMI figures released on November 22nd pushed the EURUSD down to 1.0334, breaking below 1.0448, the low set in October 2023.
As speculations mount that the European Central Bank will make a large interest rate cut at its December meeting, the downtrend is likely to continue.
Next is an analysis of the EURUSD daily chart.
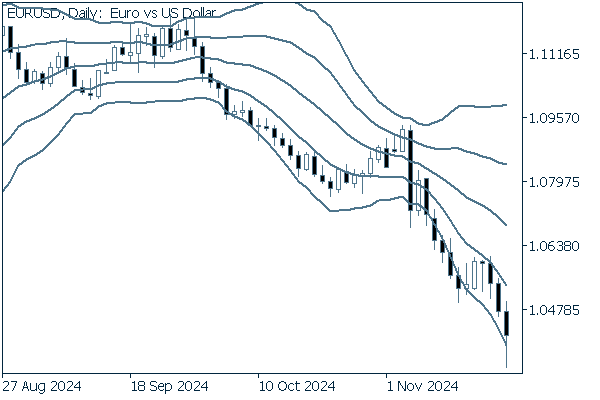

After briefly touching -1σ, the pair accelerated its downtrend. In addition, the widening bandwidth indicates that the downtrend is likely to continue.
We continue with an analysis of the EURUSD weekly chart.
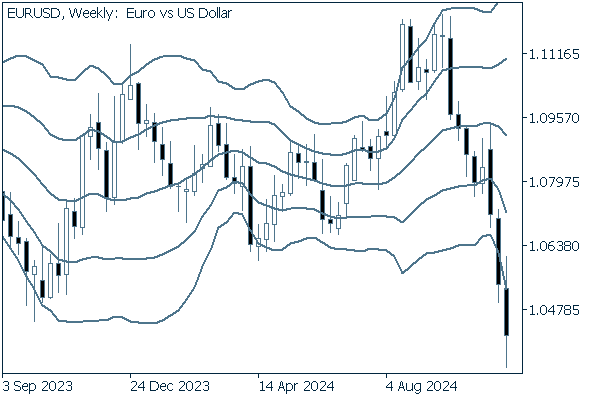

The bandwidth of the weekly chart's Bollinger Band has widened. Additionally, three consecutive negative candlesticks have been formed. Moreover, the middle line has turned downward. The pair's weekly close broke below the 2023 low of 1.0448. It is safe to say that the downtrend will continue.
GBPUSD
As with the EURUSD, dollar buying has dominated the GBPUSD. The pair has broken below 1.2612, the low set in June 2024, and is approaching the next support line at 1.2445, the low set in May 2024. The dollar's behavior will continue to dominate the pair this week.
Now, we analyze the daily GBPUSD chart.
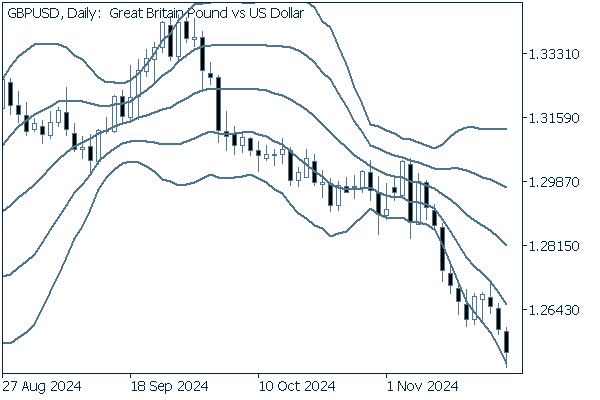

The pair's brief rebound to the -1σ level has only strengthened the downward momentum. It seems that the downtrend will continue.
Now, we analyze the daily GBPUSD chart.
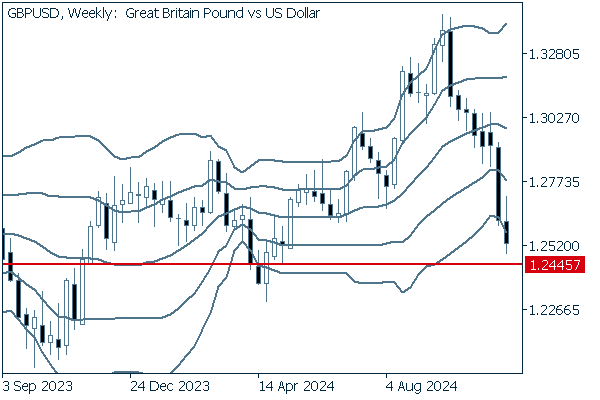

On the weekly chart, eight consecutive bearish candlesticks have been formed. The pair has dropped below -2σ. It is safe to say that the downtrend will continue. The next support line will be at 1.2445, the low set on May 9th.
Was this article helpful?
0 out of 0 people found this article helpful.
Thank you for your feedback.
FXON uses cookies to enhance the functionality of the website and your experience on it. This website may also use cookies from third parties (advertisers, log analyzers, etc.) for the purpose of tracking your activities. Cookie Policy
