2024.11.04
- Features
-
Services/ProductsServices/ProductsServices/Products

Learn more about the retail trading conditions, platforms, and products available for trading that FXON offers as a currency broker.
You can't start without it.
Trading Platforms Trading Platforms Trading Platforms
Features and functionality comparison of MetaTrader 4/5, and correspondence table of each function by OS
Two account types to choose
Trading Account Types Trading Account Types Trading Account Types
Introducing FXON's Standard and Elite accounts.
close close

-
SupportSupportSupport

Support information for customers, including how to open an account, how to use the trading tools, and a collection of QAs from the help desk.
Recommended for beginner!
Account Opening Account Opening Account Opening
Detailed explanation of everything from how to open a real account to the deposit process.
MetaTrader4/5 User Guide MetaTrader4/5 User Guide MetaTrader4/5 User Guide
The most detailed explanation of how to install and operate MetaTrader anywhere.
FAQ FAQ FAQ
Do you have a question? All the answers are here.
Coming Soon
Glossary Glossary GlossaryGlossary of terms related to trading and investing in general, including FX, virtual currencies and CFDs.
News News News
Company and License Company and License Company and License
Sitemap Sitemap Sitemap
Contact Us Contact Us Contact Us
General, personal information and privacy inquiries.
close close

- Promotion
- Trader's Market
- Partner
-
close close
Learn more about the retail trading conditions, platforms, and products available for trading that FXON offers as a currency broker.
You can't start without it.
Features and functionality comparison of MetaTrader 4/5, and correspondence table of each function by OS
Two account types to choose
Introducing FXON's Standard and Elite accounts.
Support information for customers, including how to open an account, how to use the trading tools, and a collection of QAs from the help desk.
Recommended for beginner!
Detailed explanation of everything from how to open a real account to the deposit process.
The most detailed explanation of how to install and operate MetaTrader anywhere.
Do you have a question? All the answers are here.
Coming Soon
Glossary of terms related to trading and investing in general, including FX, virtual currencies and CFDs.
General, personal information and privacy inquiries.
Useful information for trading and market information is posted here. You can also view trader-to-trader trading performance portfolios.
Find a trading buddy!
Share trading results among traders. Share operational results and trading methods.
- Legal Documents TOP
- Client Agreement
- Risk Disclosure and Warning Notice
- Order and Execution Policy
- Complaints Procedure Policy
- AML/CFT and KYC Policy
- Privacy Policy
- eKYC Usage Policy
- Cookies Policy
- Website Access and Usage Policy
- Introducer Agreement
- Business Partner Agreement
- VPS Service Terms and Condition

This article was :
published
updated
Weekly FX Market Review and Key Points for the Week Ahead
In the trading week that ended on November 3, the outcome of the House of Representatives election in Japan and financial events in the U.S. and Japan created market volatility. While political risk dominated in the first half of the week, economic indicators influenced the market in the latter half of the week.
Let's review the market movements through the week.
October 28 (Mon)
The USDJPY opened strongly higher on Monday morning following the House of Representatives election results, in which the ruling Liberal Democratic Party and the New Komeito Party failed to secure a majority. The JPY weakened against the dollar, and the pair rose from the upper 152 yen level to the upper 153 yen level. However, the market lacked any direction as the pair immediately fell back to the lower 152 yen level.
October 29 (Tue)
After reaching the upper 153 yen level again, the dollar lost some momentum against the JPY following a weaker-than-expected result for the U.S. Job Openings and Labor Turnover Survey (JOLTS) for September 2024.
Similarly, the EURUSD also fell briefly around the start of the NY session, hitting a recent low of the mid-1.07 range before rebounding.
October 30 (Wed)
The preliminary flash estimate for the Eurozone's third quarter Gross Domestic Product (GDP) showed a 0.4% increase over the previous quarter, beating expectations. Consequently, the EURUSD surged temporarily.
In addition, the U.S. ADP National Employment Report showed that private sector employment increased by 233,000 jobs in October, far ahead of the expected increase of 114,000 jobs. This data supported dollar buying. However, the advance estimate for U.S. GDP showed an increase of 2.8%, short of the expected 3.0% increase. This figure slowed the dollar's surge.
October 31 (Thu)
Following the Bank of Japan's Monetary Policy Meeting, the key interest rate was left unchanged. However, BOJ Governor Kazuo Ueda's comments led to speculation of a rate hike within this year, as he said, "We will scrutinize data available at the time at each policy meeting," rather than "We can afford to spend time gauging risks." In response, the USDJPY fell to the upper 151 yen range.
Later, the Eurozone Harmonized Index of Consumer Prices (HICP) annual inflation rate rose 2.0%. This figure beat the forecast of a 1.9% increase and triggered temporary EUR buying. In addition, the GBPUSD fell sharply from around 13:00 GMT, hitting a recent low in the mid-1.28 range.
November 1 (Fri)
The U.S. Total Non-Farm Payroll (NFP) employment increased by only 12,000 in October, far below the forecast of 113,000. This news immediately triggered dollar selling and led to a sharp drop in U.S. bond yields, pushing the USDJPY down to the 151 yen range. However, after a large volume of selling passed, the dollar rallied, and the USDJPY ended the day with dollar buying dominating.
Markets interpreted the weakness in the NFP as temporary due to the impact of the hurricane and the Boeing strike. In addition, the U.S. ISM Manufacturing PMI registered 46.5% in October, below the forecast of 47.6%, indicating a slowdown in the U.S. economy.
Economic Indicators and Statements to Watch this Week
(All times are in GMT)
November 5 (Tue)
15:00 (U.S.) ISM Non-Manufacturing PMI in October
November 7 (Thu)
Noon (U.K.) Bank of England announcement on base rate
Noon (U.K.) Bank of England Monetary Policy Committee (MPC) announcement
19:00 (U.S.) Federal Open Market Committee (FOMC), post-meeting policy rate announcement
19:30 (U.S.) Federal Reserve Board (FRB) Chair Jerome Powell holds a press conference
This Week's Forecast
The following currency pair charts are analyzed using an overlay of the ±1 and ±2 standard deviation Bollinger Bands, with a period of 20 days.
USDJPY
The U.S. presidential election is coming up on November 5th. It will be necessary to pay close attention to the impact of the election results on the market.
Next is an analysis of the USDJPY daily chart.
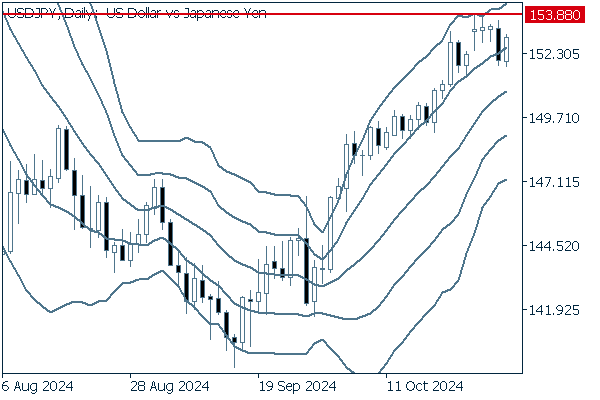

The middle line shows an upward trend, and while the second candle from the right in the image (October 31) closed below +1σ, the following day's closing price returned above that level.It will be important to see whether the pair will break above its high of 153.88 yen reached on October 28th.
We continue with an analysis of the USDJPY weekly chart.
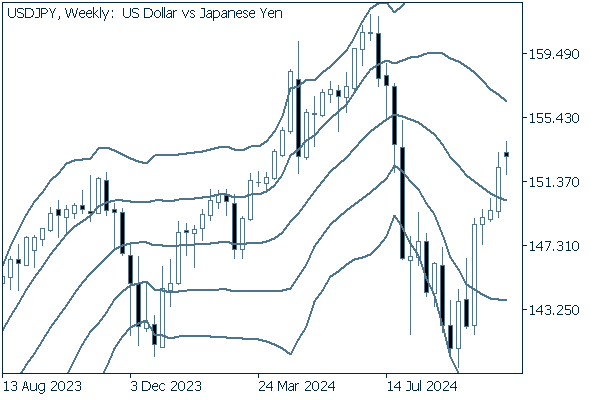

The weekly USDJPY chart, which had shown four consecutive weeks of gains, formed a bearish candlestick last week.
With the middle line pointing downward, the pair could revert to its downward trend.
EURUSD
The long downtrend in the wake of the strong dollar has paused, and the EURUSD appears to be entering a rebound phase. The pair is likely to see volatility following the U.S. presidential election on November 5th and the FOMC meeting on November 6th and 7th, where the possibility of another interest rate cut will be discussed.
Next is an analysis of the EURUSD daily chart.
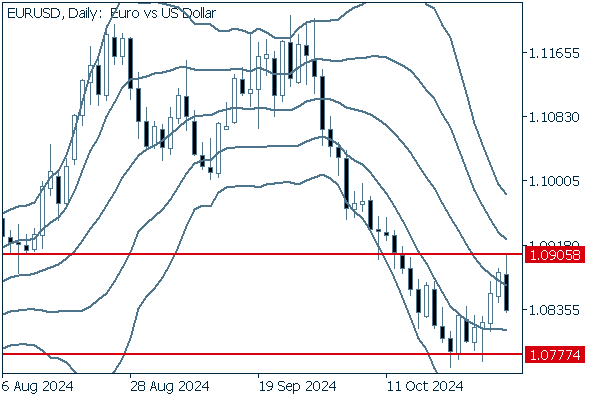

After the downward bandwalk, the EURUSD rallied to around the middle line of the Bollinger Band. However, as indicated by a slightly long upper tail, the pair temporarily reached 1.0905 and then fell back on November 1. If the pair clearly breaks through this level, a trend reversal may occur. However, it is also necessary to be cautious about the continuation of the bearish trend.
We continue with an analysis of the EURUSD weekly chart.
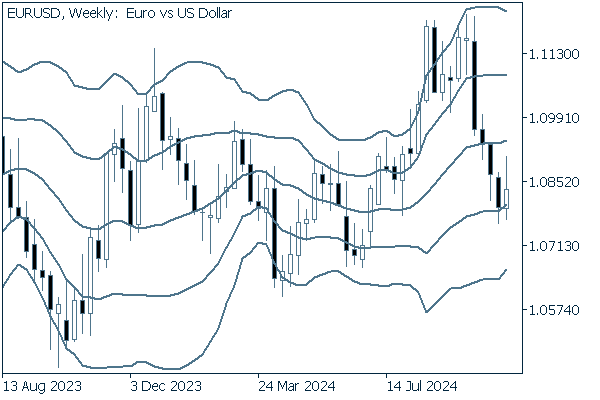

After four consecutive bearish candlesticks appeared on the chart, the EURUSD rallied, with both the high and low prices rising. On this timeframe, we can see that the middle line lacks a significant slope, indicating that there is no major trend present.
GBPUSD
The week of November 4th will also see the GBPUSD affected by major events that could lead to a significant move in the USD.
Now, we analyze the daily GBPUSD chart.
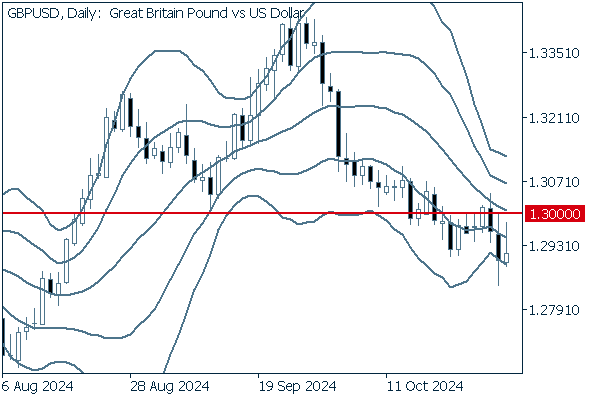

The GBPUSD briefly broke above the resistance level of 1.3000 but failed to reverse the trend and is now in a downtrend along -1σ. The narrowing Bollinger Band width signals caution against unexpected sharp movements.
We continue with an analysis of the GBPUSD weekly chart.
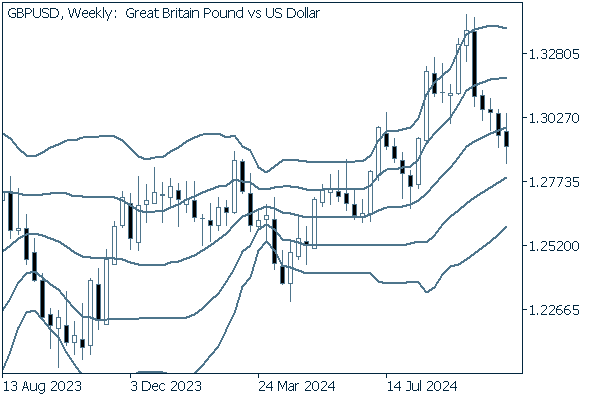

On the weekly chart, the GBPUSD has broken well below the middle line. The downtrend will likely continue.
Was this article helpful?
0 out of 0 people found this article helpful.
Thank you for your feedback.
FXON uses cookies to enhance the functionality of the website and your experience on it. This website may also use cookies from third parties (advertisers, log analyzers, etc.) for the purpose of tracking your activities. Cookie Policy
