2024.10.28
- Features
-
Services/ProductsServices/ProductsServices/Products

Learn more about the retail trading conditions, platforms, and products available for trading that FXON offers as a currency broker.
You can't start without it.
Trading Platforms Trading Platforms Trading Platforms
Features and functionality comparison of MetaTrader 4/5, and correspondence table of each function by OS
Two account types to choose
Trading Account Types Trading Account Types Trading Account Types
Introducing FXON's Standard and Elite accounts.
close close

-
SupportSupportSupport

Support information for customers, including how to open an account, how to use the trading tools, and a collection of QAs from the help desk.
Recommended for beginner!
Account Opening Account Opening Account Opening
Detailed explanation of everything from how to open a real account to the deposit process.
MetaTrader4/5 User Guide MetaTrader4/5 User Guide MetaTrader4/5 User Guide
The most detailed explanation of how to install and operate MetaTrader anywhere.
FAQ FAQ FAQ
Do you have a question? All the answers are here.
Coming Soon
Glossary Glossary GlossaryGlossary of terms related to trading and investing in general, including FX, virtual currencies and CFDs.
News News News
Company and License Company and License Company and License
Sitemap Sitemap Sitemap
Contact Us Contact Us Contact Us
General, personal information and privacy inquiries.
close close

- Promotion
- Trader's Market
- Partner
-
close close
Learn more about the retail trading conditions, platforms, and products available for trading that FXON offers as a currency broker.
You can't start without it.
Features and functionality comparison of MetaTrader 4/5, and correspondence table of each function by OS
Two account types to choose
Introducing FXON's Standard and Elite accounts.
Support information for customers, including how to open an account, how to use the trading tools, and a collection of QAs from the help desk.
Recommended for beginner!
Detailed explanation of everything from how to open a real account to the deposit process.
The most detailed explanation of how to install and operate MetaTrader anywhere.
Do you have a question? All the answers are here.
Coming Soon
Glossary of terms related to trading and investing in general, including FX, virtual currencies and CFDs.
General, personal information and privacy inquiries.
Useful information for trading and market information is posted here. You can also view trader-to-trader trading performance portfolios.
Find a trading buddy!
Share trading results among traders. Share operational results and trading methods.
- Legal Documents TOP
- Client Agreement
- Risk Disclosure and Warning Notice
- Order and Execution Policy
- Complaints Procedure Policy
- AML/CFT and KYC Policy
- Privacy Policy
- eKYC Usage Policy
- Cookies Policy
- Website Access and Usage Policy
- Introducer Agreement
- Business Partner Agreement
- VPS Service Terms and Condition

This article was :
published
updated
Weekly FX Market Review and Key Points for the Week Ahead
In the trading week ended October 27, the dollar strengthened and the yen weakened in the foreign exchange market, with the USDJPY briefly jumping from below 150 to reach as far as above 153 yen at the beginning of the week. However, in the latter half of the week, the USDJPY fell back to below 152 yen due to comments by Japanese government officials suggesting checks on the yen's depreciation.
Strength in the dollar has also affected the EURUSD, which has fallen from the upper 1.08 range to the lower 1.07 range, and the GBPUSD from the upper 1.30 range to the lower 1.29 range.
Let's review the market movements through the week.
October 21 (Mon)
The USDJPY opened the trading week between 149 and 150 yen. Dollar buying would then take hold on the back of rising U.S. long-term interest rates, sending the pair to the upper 150 level.
October 22 (Tue)
As U.S. Treasury yields continued to rise, the dollar rose, and with it the USDJPY further to above 151. The dominant view in the market was that the Federal Reserve Bank would not cut interest rates before the end of 2024, likely increasing demand for the dollar.
The GBPUSD was also affected by the strong dollar on the day, falling to the lower 1.29 range.
October 23 (Wed)
When it was reported that former President Trump was ahead in the U.S. presidential election, the market was propped up by expectations of accelerating inflation and a stronger dollar following a potential Trump re-election, and the USDJPY temporarily surged to above 153.
The EURUSD also fell to the upper 1.07 range due to the strong dollar.
October 24 (Thu)
Despite a strong annualized September new home sales reading in the U.S. of 738,000 (forecast: 720,000, previous: 716,000), dollar selling prevailed as U.S. long-term interest rates declined, sending the USDJPY back down below 152.
Later, there was a short-lived rebound in the pair due to strong data in U.S. initial unemployment insurance claims and other factors.
October 25 (Fri)
Heading into the weekend, USDJPY trades were careful and retrospect ahead of the Bank of Japan's monetary policy meeting, with a number of statements from the Ministry of Finance and Japanese government officials cautioning against a weaker yen. The USDJPY held the line above 151 as Japan's Finance Minister, Deputy Chief Cabinet Secretary, and top currency diplomat, among others, suggested restraining the sharp depreciation of the yen.
Economic Indicators and Statements to Watch this Week
(All times are in GMT)
October 30 (Wed)
10:00, Europe: July-September quarterly regional gross domestic product (preliminary regional GDP)
12:15, U.S.: October ADP National Employment Report
12:30, U.S.: July-September quarterly real gross domestic product (preliminary GDP)
October 31 (Thu)
Time TBD, Japan: Bank of Japan Monetary Policy Meeting, post-meeting policy rate announcement
Time TBD, Japan: Bank of Japan Outlook Report
06:30, Japan: Regular press conference by Bank of Japan Governor Kazuo Ueda
10:00, Europe: October Harmonised Index of Consumer Prices (preliminary HICP, preliminary HICP core index)
12:30, U.S.: September personal consumption expenditures (PCE deflator)
12:30, U.S.: September personal consumption expenditures (core PCE deflator, excluding food and energy)
November 1 (Fri)
12:30, U.S.: October change in nonfarm payrolls
12:30, U.S.: October unemployment rate
12:30, U.S.: October average hourly earnings
14:00, U.S.: October ISM Manufacturing PMI
Japan's lower house elections have just completed, and the U.S. presidential election is scheduled just ahead, on November 5. In the meantime, the Bank of Japan's monetary policy meeting and the U.S. employment data release are also scheduled, so it is possible that dynamics may be complex and challenging in the market for some time.
This Week's Forecast
The following currency pair charts are analyzed using an overlay of the ±1 and ±2 standard deviation Bollinger Bands, with a period of 20 days.
USDJPY
Looking back at past U.S. presidential elections, with the exception of 2020, the USDJPY has generally rallied after the election. Trading in the current market will require building an accurate narrative for how the market is evaluating the just-concluded lower house election in Japan and how this will lead to the U.S. election and affect markets.
Next is an analysis of the USDJPY daily chart.
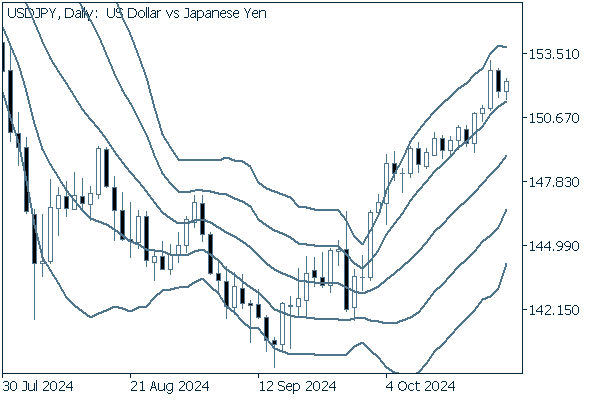

The pair continues a textbook upward bandwalk. Though it nearly fell below the +1 standard deviation Bollinger Band several times, each time it rebounded and continued its upswing. As long as the pair does not clearly fall below the +1 band at the close, a bullish eye should be acceptable.
We continue with an analysis of the USDJPY weekly chart.
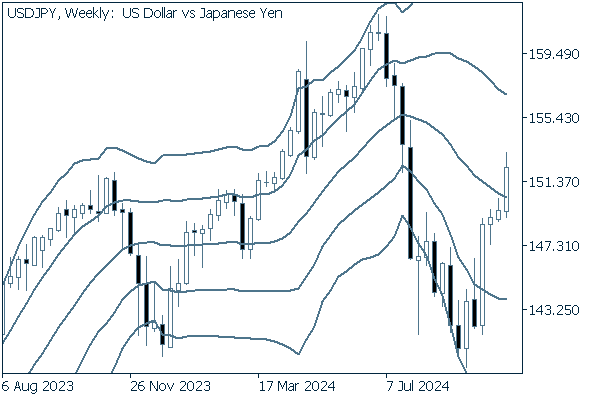

This pair turned positive after a downward bandwalk, going so far as to break above the middle line. With a four-week positive streak, there appears to still be relatively strong upward momentum in the chart.
EURUSD
The political and economic situation for the euro is a little less high-profile versus its dollar counterpart, and somewhat more stable. This has led to a generally dollar-driven trend for several years.
The dollar has been strong recently, and the EURUSD and GBPUSD have continued their downtrends. The key point will be whether the U.S. presidential election will change this trend.
Next is an analysis of the EURUSD daily chart.
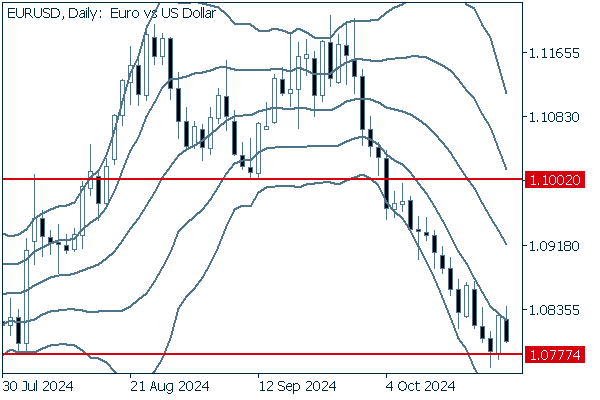

After breaking below 1.1002, the neckline of the double top, the pair entered a clean downward bandwalk, pausing at the previous low near 1.0777.
If the pair slips below this line, there will be a continuation of the decline.
We continue with an analysis of the EURUSD weekly chart.
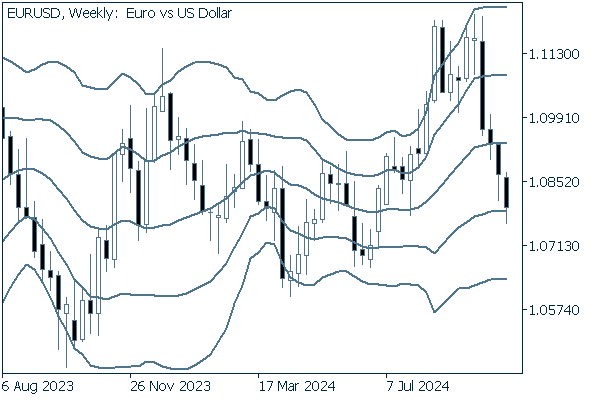

The weekly chart shows four consecutive bearish candles, with lower wicks extending near the -1σ level, confirming a prevailing selling pressure.
GBPUSD
The GBPUSD is likely to work under the same concept as its EURUSD cousin. Once again, the strategy is to follow the dollar's movements.
Now, we analyze the daily GBPUSD chart.
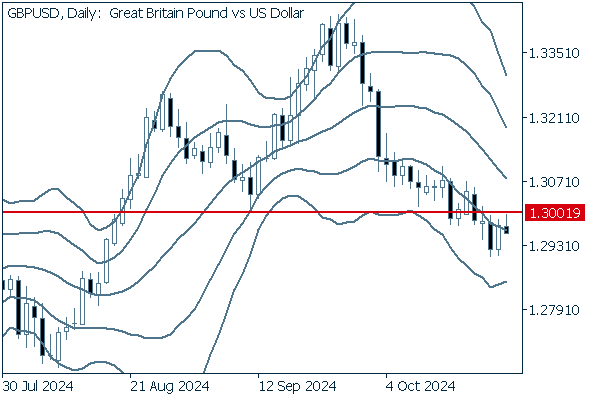

Though the downside momentum is by no means strong, the pair has broken below 1.3001, the recent low and milestone price, which has converted from a resistance to a support.
We continue with an analysis of the GBPUSD weekly chart.
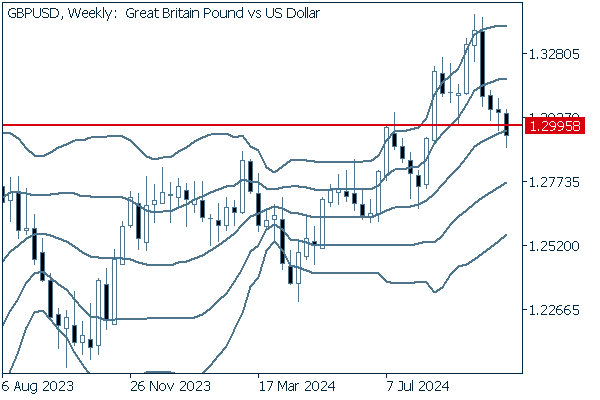

The weekly chart suggests a predominantly bearish posture given that the pair has fallen below a milestone price at the close.
Was this article helpful?
0 out of 0 people found this article helpful.
Thank you for your feedback.
FXON uses cookies to enhance the functionality of the website and your experience on it. This website may also use cookies from third parties (advertisers, log analyzers, etc.) for the purpose of tracking your activities. Cookie Policy
