2024.10.21
- Features
-
Services/ProductsServices/ProductsServices/Products

Learn more about the retail trading conditions, platforms, and products available for trading that FXON offers as a currency broker.
You can't start without it.
Trading Platforms Trading Platforms Trading Platforms
Features and functionality comparison of MetaTrader 4/5, and correspondence table of each function by OS
Two account types to choose
Trading Account Types Trading Account Types Trading Account Types
Introducing FXON's Standard and Elite accounts.
close close

-
SupportSupportSupport

Support information for customers, including how to open an account, how to use the trading tools, and a collection of QAs from the help desk.
Recommended for beginner!
Account Opening Account Opening Account Opening
Detailed explanation of everything from how to open a real account to the deposit process.
MetaTrader4/5 User Guide MetaTrader4/5 User Guide MetaTrader4/5 User Guide
The most detailed explanation of how to install and operate MetaTrader anywhere.
FAQ FAQ FAQ
Do you have a question? All the answers are here.
Coming Soon
Glossary Glossary GlossaryGlossary of terms related to trading and investing in general, including FX, virtual currencies and CFDs.
News News News
Company and License Company and License Company and License
Sitemap Sitemap Sitemap
Contact Us Contact Us Contact Us
General, personal information and privacy inquiries.
close close

- Promotion
- Trader's Market
- Partner
-
close close
Learn more about the retail trading conditions, platforms, and products available for trading that FXON offers as a currency broker.
You can't start without it.
Features and functionality comparison of MetaTrader 4/5, and correspondence table of each function by OS
Two account types to choose
Introducing FXON's Standard and Elite accounts.
Support information for customers, including how to open an account, how to use the trading tools, and a collection of QAs from the help desk.
Recommended for beginner!
Detailed explanation of everything from how to open a real account to the deposit process.
The most detailed explanation of how to install and operate MetaTrader anywhere.
Do you have a question? All the answers are here.
Coming Soon
Glossary of terms related to trading and investing in general, including FX, virtual currencies and CFDs.
General, personal information and privacy inquiries.
Useful information for trading and market information is posted here. You can also view trader-to-trader trading performance portfolios.
Find a trading buddy!
Share trading results among traders. Share operational results and trading methods.
- Legal Documents TOP
- Client Agreement
- Risk Disclosure and Warning Notice
- Order and Execution Policy
- Complaints Procedure Policy
- AML/CFT and KYC Policy
- Privacy Policy
- eKYC Usage Policy
- Cookies Policy
- Website Access and Usage Policy
- Introducer Agreement
- Business Partner Agreement
- VPS Service Terms and Condition

This article was :
published
updated
Weekly FX Market Review and Key Points for the Week Ahead
The trading week ended October 20 was one of general favorability toward dollar strength. In particular, the market recognized strength in the U.S. economy, including from September retail sales exceeding expectations, and expectations on a significant rate cut by U.S. monetary authorities receded. The USDJPY pair temporarily broke above 150, but Japanese government officials' comments on curbing the yen's depreciation sent it back down below 150 once again.
The EURUSD and GBPUSD also came under increased selling pressure, influenced by their respective economic indicators, but into the weekend, there were moments where the GBPUSD rebounded.
Let's review the market movements through the week.
October 14 (Mon)
Market liquidity was low on the day due to national holidays in the U.S. and Japan, with the USDJPY largely aimless in the low 149 range during the Tokyo session.
However, during the New York session, the Dow Jones Industrial Average hit a new all-time high, triggering dollar buying and rallying the USDJPY to as far as just below 150.
October 15 (Tue)
With the failure of the USDJPY on Monday to cross the 150 milestone, dollar bulls prevailed on Tuesday, and the pair fell back to the upper 148 range. A lull in the rally in U.S. equities and profit-taking were seen as influential.
October 16 (Wed)
Yen bears were reinvigorated after Adachi Seiji, member of the Bank of Japan's Policy Board, demonstrated a cautious stance on additional interest rate hikes. The USDJPY rose once again to the upper 149 range.
Also on this day, the Consumer Price Index (CPI) for the U.K. was released. The weak month-over-month figure of 0.1% expected vs. 0.0% result triggered a significant drop in the GBPUSD immediately after the announcement, going as far as below 1.30.
October 17 (Thu)
As for the euro, the EURUSD fell to around 1.081 on increased selling pressure due to the sluggish German economy and dovish comments from the European Central Bank. The pound was saw a short drop due to a slowdown in U.K. inflation indicators.
Also released on the same day, U.S. retail sales for September came in at 0.4% month-over-month, exceeding the forecast of 0.3%, confirming the strength of the U.S. economy. This led to momentum for dollar bulls, sending the USDJPY to as high as around 150.32.
October 18 (Fri)
The dollar fell back below 150 as greater awareness of potential yen depreciation controls to come after Japan's top currency diplomat indicated that the government would be watching any speculative moves in the currency with great interest.
Over to the GBPUSD, the pair briefly rebounded following the strong U.K. retail sales results released on the day, but overall it was a week of mixed direction.
Economic Indicators and Statements to Watch this Week
(All times are in GMT)
October 24 (Thu)
14:00, U.S.: September new home sales
This Week's Forecast
The following currency pair charts are analyzed using an overlay of the ±1 and ±2 standard deviation Bollinger Bands, with a period of 20 days.
USDJPY
According to the CME's FedWatch tool, of the two remaining FOMC meetings for 2024, more than 90% of the market has factored in a 0.25% rate cut at the November meeting. Furthermore, at the December FOMC meeting, a further 0.25% rate cut from there is now in the majority.
Next is an analysis of the USDJPY daily chart.
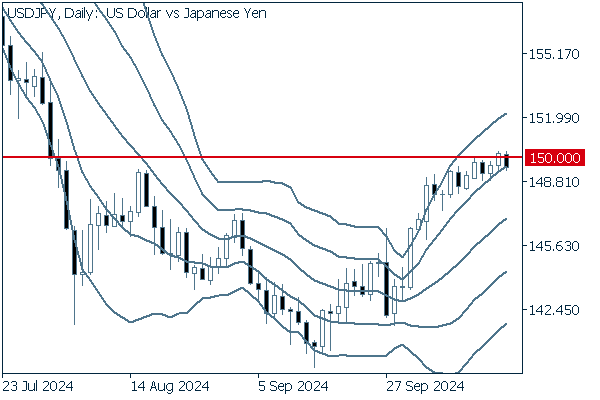

The pair had been in an upward bandwalk, slowly rising to reach the milestone level of 150. From there, the price fell back, but did not break below the +1 standard deviation Bollinger Band support before closing the week's trading.
Whether or not the pair can hold above the +1 band and firmly surpass 150 again will determine the future trend.
We continue with an analysis of the USDJPY weekly chart.
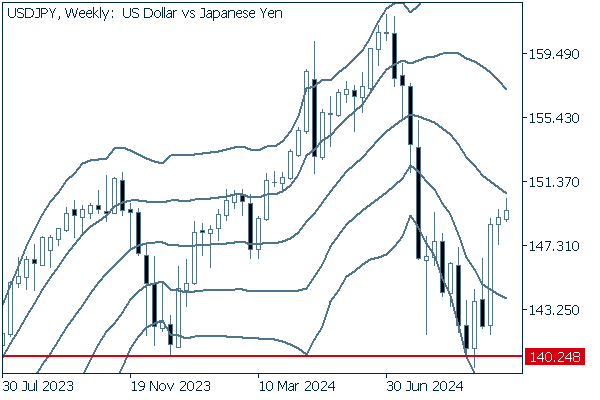

The positive trend has continued after a decisive move above the -1 standard deviation Bollinger Band, but the pair lost momentum and fell back before reaching the middle line.
With a steadily falling middle line and the latest candle below the line, the market appears to be in a bearish posture over the long term.
EURUSD
There are no major economic indicators or key figures scheduled for this week in relation to the euro. Since the dollar's only major fundamental driver will also be the number of new home sales, a chart analysis-driven posture looks to be effective.
However, there is always a possibility that the market may move significantly due to sudden statements by key figures, such as statements by Bank of Japan officials.
Next is an analysis of the EURUSD daily chart.
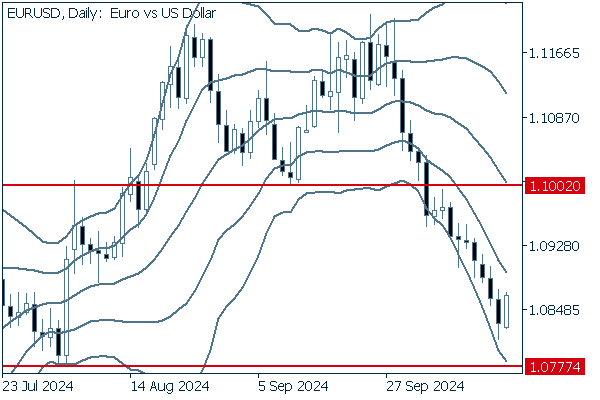

The pair had been on a seven-day losing streak until the most recent Friday candlestick rebounded.
The bandwalk continues after a break below 1.1002, also around the neckline of the double top, and if it continues, the next target will be the recent low at 1.0777.
We continue with an analysis of the EURUSD weekly chart.
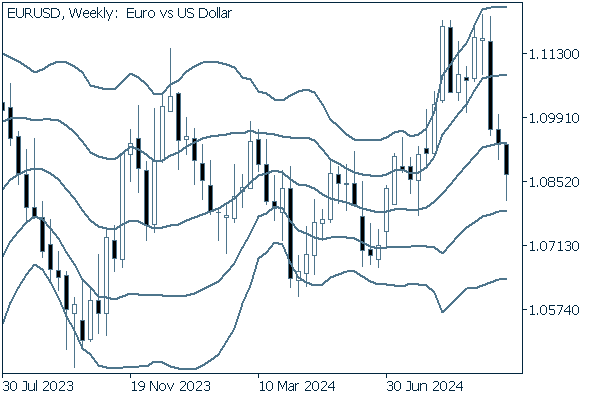

The weekly chart shows no major trend, suggesting that the pair is range-bound.
Watching for a possible rebound off the -2 standard deviation Bollinger Band could also be an effective strategy.
GBPUSD
The GBPUSD threatens the 1.30 area, which has been a milestone level many times over the years. Which way the pair breaks from here will be of great interest.
Now, we analyze the daily GBPUSD chart.
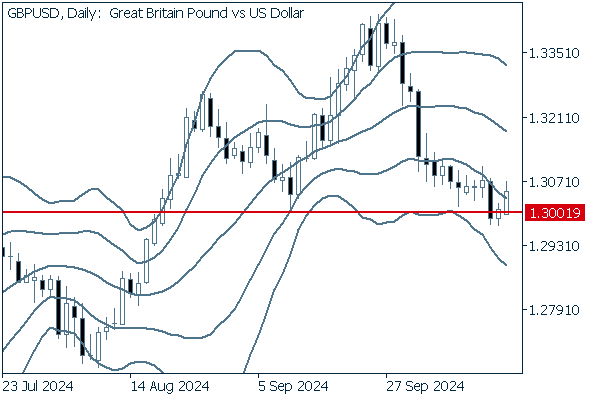

Though the pair dipped below 1.3001, it retreated above the level in a false breakout. If this line were to become the focal point of back-and-forth trades, it is likely that the pair will explode with pent-up momentum after a time.
We continue with an analysis of the GBPUSD weekly chart.
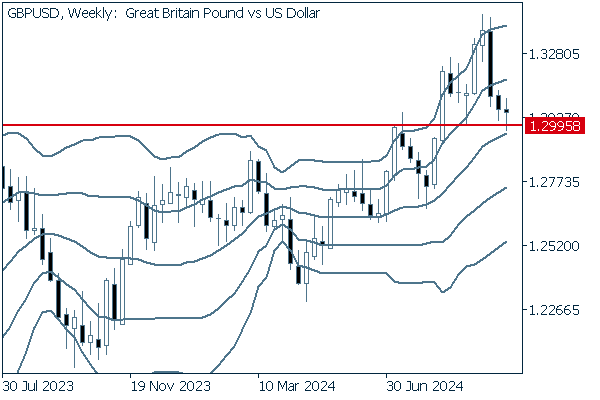

Looking at the weekly trend, it is hard to ignore the importance of how the price moves around the 1.30 level. At the moment, the price is rebounding off this resistance-turned-support.
Was this article helpful?
0 out of 0 people found this article helpful.
Thank you for your feedback.
FXON uses cookies to enhance the functionality of the website and your experience on it. This website may also use cookies from third parties (advertisers, log analyzers, etc.) for the purpose of tracking your activities. Cookie Policy
