2024.10.07
- Features
-
Services/ProductsServices/ProductsServices/Products

Learn more about the retail trading conditions, platforms, and products available for trading that FXON offers as a currency broker.
You can't start without it.
Trading Platforms Trading Platforms Trading Platforms
Features and functionality comparison of MetaTrader 4/5, and correspondence table of each function by OS
Two account types to choose
Trading Account Types Trading Account Types Trading Account Types
Introducing FXON's Standard and Elite accounts.
close close

-
SupportSupportSupport

Support information for customers, including how to open an account, how to use the trading tools, and a collection of QAs from the help desk.
Recommended for beginner!
Account Opening Account Opening Account Opening
Detailed explanation of everything from how to open a real account to the deposit process.
MetaTrader4/5 User Guide MetaTrader4/5 User Guide MetaTrader4/5 User Guide
The most detailed explanation of how to install and operate MetaTrader anywhere.
FAQ FAQ FAQ
Do you have a question? All the answers are here.
Coming Soon
Glossary Glossary GlossaryGlossary of terms related to trading and investing in general, including FX, virtual currencies and CFDs.
News News News
Company and License Company and License Company and License
Sitemap Sitemap Sitemap
Contact Us Contact Us Contact Us
General, personal information and privacy inquiries.
close close

- Promotion
- Trader's Market
- Partner
-
close close
Learn more about the retail trading conditions, platforms, and products available for trading that FXON offers as a currency broker.
You can't start without it.
Features and functionality comparison of MetaTrader 4/5, and correspondence table of each function by OS
Two account types to choose
Introducing FXON's Standard and Elite accounts.
Support information for customers, including how to open an account, how to use the trading tools, and a collection of QAs from the help desk.
Recommended for beginner!
Detailed explanation of everything from how to open a real account to the deposit process.
The most detailed explanation of how to install and operate MetaTrader anywhere.
Do you have a question? All the answers are here.
Coming Soon
Glossary of terms related to trading and investing in general, including FX, virtual currencies and CFDs.
General, personal information and privacy inquiries.
Useful information for trading and market information is posted here. You can also view trader-to-trader trading performance portfolios.
Find a trading buddy!
Share trading results among traders. Share operational results and trading methods.
- Legal Documents TOP
- Client Agreement
- Risk Disclosure and Warning Notice
- Order and Execution Policy
- Complaints Procedure Policy
- AML/CFT and KYC Policy
- Privacy Policy
- eKYC Usage Policy
- Cookies Policy
- Website Access and Usage Policy
- Introducer Agreement
- Business Partner Agreement
- VPS Service Terms and Condition

This article was :
published
updated
Weekly FX Market Review and Key Points for the Week Ahead
In the currency exchange markets during the trading week ended October 6, the dollar strengthened against the yen, with the USDJPY rising sharply from above 141 to as far as above 149. The main factors for this rise were the dollar's stronger buying power due to receding expectations of an interest rate hike by the Bank of Japan, solid results in U.S. economic indicators, and Federal Reserve Chairman Jerome Powell's stance of not rushing to cut interest rates. Furthermore, Friday's strong U.S. jobs report accelerated dollar buying even more.
As for the GBPUSD, a factor spurring bearish momentum was the suggestion of a possible interest rate cut by the Bank of England.
Let's review the market movements through the week.
September 30 (Mon)
The USDJPY opened the week in the lower 142 range, following the yen's appreciation in what is called the "Ishiba shock" following the election of new Japanese Prime Minister Shigeru Ishiba at the end of the previous week.
In the Tokyo market, the Nikkei 225 index fell and the USDJPY dropped to the upper 141 range, but dollar buying strengthened as U.S. long-term interest rates recovered, and the USDJPY recovered to above 142 level by the end of the day.
October 1 (Tue)
Tuesday marked a continuation of the USDJPY's uptrend, as the pair rise temporarily to the mid-144 range. Fed Chairman Jerome Powell's comment on the previous day that there was no need to rush to cut interest rates also encouraged dollar bulls.
However, rising tensions in the Middle East and Iran's missile attack on Israel triggered risk aversion in the market, causing the USDJPY to temporarily fall to the upper 142 range.
Both the EURUSD and GBPUSD also fell on Tuesday, marking respective lows near 1.10 and 1.32.
October 2 (Wed)
Japanese Prime Minister Ishiba took a cautious stance on raising interest rates, stating clearly that the government is not in an environment for additional rate hikes at this time. This statement led to a sell-off of the yen and a rise in the USDJPY.
Furthermore, the U.S. ADP employment report for September showed an increase of 143,000 jobs, exceeding the forecast of 120,000, which accelerated dollar buying and sending the USDJPY past 146.
October 3 (Thu)
For the USDJPY, despite a U.S. September ISM Non-Manufacturing PMI well above expectations, at 54.9 vs. 51.7, a strong dollar-buying trend did not emerge.
Meanwhile, the GBPUSD fell from above 1.32 to around 1.31 in response to Bank of England Governor Andrew Bailey's suggestion that the bank may cut rates a bit more aggressively.
October 4 (Fri)
On the same day, the much-awaited U.S. jobs report for September was released, and the number of nonfarm payrolls came in strong at 254,000, well above the market forecast of 140,000. As a result, expectations of a significant interest rate cut in the U.S. completely receded, and the USDJPY briefly rose to around 149.
Economic Indicators and Statements to Watch this Week
(All times are in GMT)
October 9 (Wed)
18:00, U.S.: Federal Reserve Open Market Committee (FOMC) meeting minutes
October 10 (Thu)
12:30, U.S.: September Consumer Price Index (CPI)12:30, U.S.: September Consumer Price Index (CPI core index)
October 11 (Fri)
06:00, U.K.: August monthly gross domestic product (GDP)
With key events such as the U.S. FOMC meeting and the U.S. Consumer Price Index (CPI) release coming up this week, it will be interesting to see how market expectations for monetary policy will change.
This Week's Forecast
The following currency pair charts are analyzed using an overlay of the ±1 and ±2 standard deviation Bollinger Bands, with a period of 20 days.
USDJPY
The USDJPY continues to be highly sensitive to the turbulent developments amid the crowning of a new prime minister in Japan. This may be a difficult pair to trade at the moment given its tendency to swing violently up or down depending on a single news release. This can be seen in the quick pivot from yen bears when Ms. Sanae Takaichi appears to lead the ruling party presidential election, to yen bulls when Mr. Ishiba came back to win the election and become Japan's Prime Minister, then to yen bears once again when Mr. Ishiba demonstrated a passive stance the next week regarding interest rate hikes.
Next is an analysis of the USDJPY daily chart.
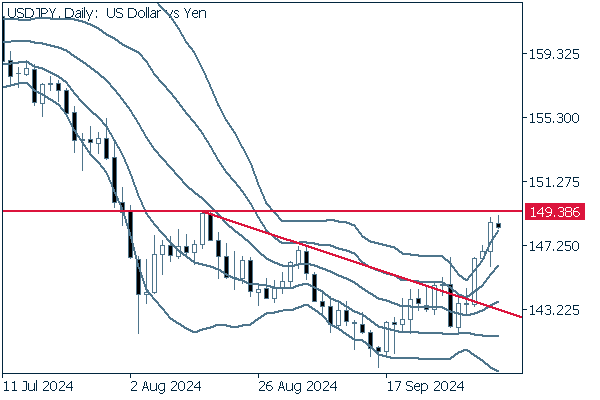

The pair has broken above its downtrend line and has come quite close to 149.38, the rebound high after summer's big drop.
An upward bandwalk of the Bollinger Band may have also begun, and a buy mentality seems appropriate for this time frame.
We continue with an analysis of the USDJPY weekly chart.
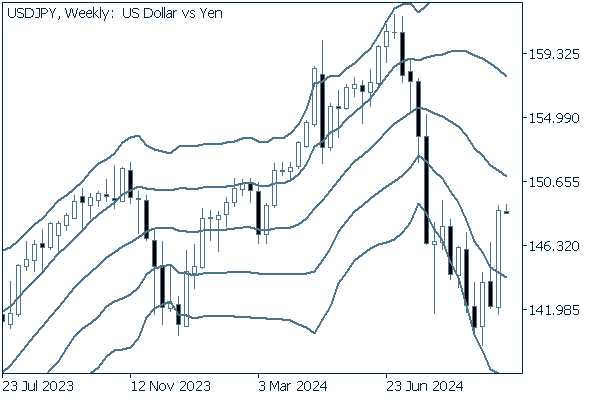

The new long positive candle from the most recent week negated the descending bandwalk in one shot, sending the pair above the -1 standard deviation band with resounding resolve.
The weekly chart can be interpreted as if the downtrend has ended.
EURUSD
Europe's September Harmonised Index of Consumer Prices that came out in the most recent week met with expectations. There has been no major news for the currency, and since the euro is considered to be in a stable state, so to speak, the main movement is likely to be driven by dollar developments, as has been the trend over the past few years.
Next is an analysis of the EURUSD daily chart.
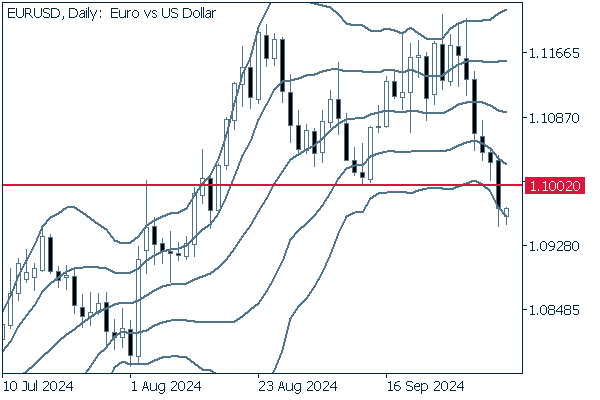

The pair began to form a double top, but then broke below the neckline at the close. This is a textbook formation that usually leads to a further fall, so short strategies may be preferable here.
We continue with an analysis of the EURUSD weekly chart.
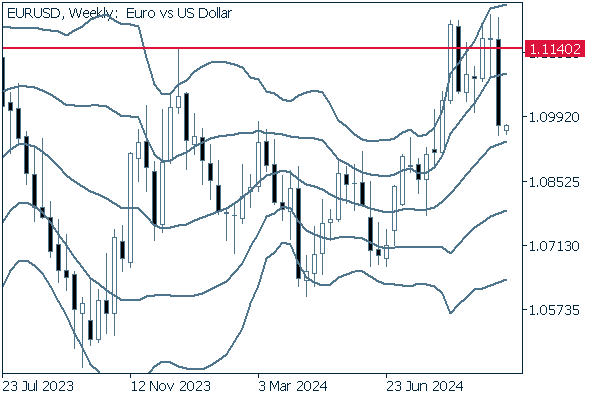

The highly effective 1.1149 resistance line prevented the pair from a clear break above, and the pair finally fell cleanly back from it in the most recent week. In addition, since the upward bandwalk has now ended with a close below the +1 standard deviation Bollinger Band, it is natural to assume that we have moved into a phase of strong selling pressure.
GBPUSD
As already mentioned, the Bank of England's more favorable stance toward interest rate cuts has strengthened bearish momentum for the pound. As a result, the GBPUSD is likely to come under increased selling pressure.
Now, we analyze the daily GBPUSD chart.
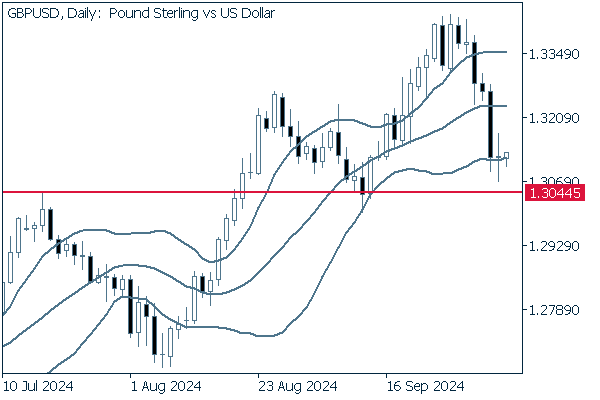

The pair has marked four consecutive negative candles to approach 1.3044, a resistance turned support. A break below this line would assure further-falling lows and eliminate uptrend conditions.
We continue with an analysis of the GBPUSD weekly chart.
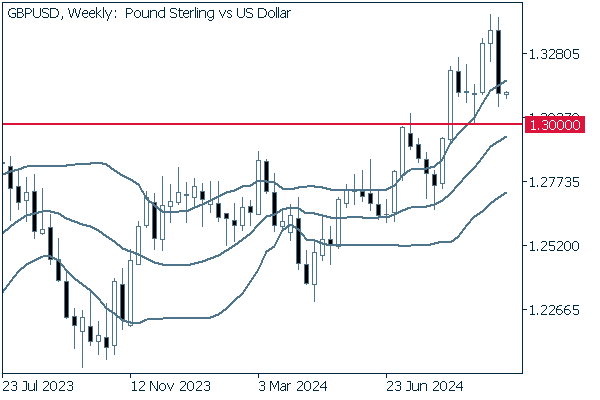

Whether or not the pair breaks below the milestone line near 1.30 will largely determine its future trend.
Was this article helpful?
0 out of 0 people found this article helpful.
Thank you for your feedback.
FXON uses cookies to enhance the functionality of the website and your experience on it. This website may also use cookies from third parties (advertisers, log analyzers, etc.) for the purpose of tracking your activities. Cookie Policy
