2024.09.09
- Features
-
Services/ProductsServices/ProductsServices/Products

Learn more about the retail trading conditions, platforms, and products available for trading that FXON offers as a currency broker.
You can't start without it.
Trading Platforms Trading Platforms Trading Platforms
Features and functionality comparison of MetaTrader 4/5, and correspondence table of each function by OS
Two account types to choose
Trading Account Types Trading Account Types Trading Account Types
Introducing FXON's Standard and Elite accounts.
close close

-
SupportSupportSupport

Support information for customers, including how to open an account, how to use the trading tools, and a collection of QAs from the help desk.
Recommended for beginner!
Account Opening Account Opening Account Opening
Detailed explanation of everything from how to open a real account to the deposit process.
MetaTrader4/5 User Guide MetaTrader4/5 User Guide MetaTrader4/5 User Guide
The most detailed explanation of how to install and operate MetaTrader anywhere.
FAQ FAQ FAQ
Do you have a question? All the answers are here.
Coming Soon
Glossary Glossary GlossaryGlossary of terms related to trading and investing in general, including FX, virtual currencies and CFDs.
News News News
Company and License Company and License Company and License
Sitemap Sitemap Sitemap
Contact Us Contact Us Contact Us
General, personal information and privacy inquiries.
close close

- Promotion
- Trader's Market
- Partner
-
close close
Learn more about the retail trading conditions, platforms, and products available for trading that FXON offers as a currency broker.
You can't start without it.
Features and functionality comparison of MetaTrader 4/5, and correspondence table of each function by OS
Two account types to choose
Introducing FXON's Standard and Elite accounts.
Support information for customers, including how to open an account, how to use the trading tools, and a collection of QAs from the help desk.
Recommended for beginner!
Detailed explanation of everything from how to open a real account to the deposit process.
The most detailed explanation of how to install and operate MetaTrader anywhere.
Do you have a question? All the answers are here.
Coming Soon
Glossary of terms related to trading and investing in general, including FX, virtual currencies and CFDs.
General, personal information and privacy inquiries.
Useful information for trading and market information is posted here. You can also view trader-to-trader trading performance portfolios.
Find a trading buddy!
Share trading results among traders. Share operational results and trading methods.
- Legal Documents TOP
- Client Agreement
- Risk Disclosure and Warning Notice
- Order and Execution Policy
- Complaints Procedure Policy
- AML/CFT and KYC Policy
- Privacy Policy
- eKYC Usage Policy
- Cookies Policy
- Website Access and Usage Policy
- Introducer Agreement
- Business Partner Agreement
- VPS Service Terms and Condition

This article was :
published
updated
Weekly FX Market Review and Key Points for the Week Ahead
In the trading week ended September 8th, currency markets saw rapid dollar sell-offs following tepid results in the U.S. jobs report for August. Weakness in the U.S. labor market was highlighted by lower-than-expected nonfarm payrolls (NFP) and downward revisions to June and July data.
This resulted in even stronger expectations for a rate cut at the September FOMC meeting, sending the USDJPY plummeting as far as below 142, if temporarily. The EURUSD rose to the upper 1.11 range and the GBPUSD, also reacting to a weakening dollar, reached a high around 1.32.
Let's review the market movements through the week.
Trading was thin to open the week on Monday the 2nd as markets in New York were closed for Labor Day. Meanwhile, the USDJPY continued its trend from the weekend just prior, rising from the upper 145 range to the low 147 range. This trend came amid an as-expected release of U.S. personal consumption expenditures for July on Friday, August 30, strengthening the outlook that the FOMC will cut interest rates by only 0.25%.
On Tuesday the 3rd, the dollar sold off against a resurgent yen amid a sagging U.S. stock market and lower U.S. long-term interest rates. Then, after the August ISM Manufacturing PMI came in below expectations(47.5) at 47.2, the USDJPY fell back below 146 yen. With a weakening dollar, the EURUSD traded in the 1.10 range and the GBPUSD rose to around 1.31.
On Wednesday, September 4, the Job Openings and Labor Turnover Survey (JOLTS) came in much lower than expected(8,100,000) at 7,673,000, further accelerating dollar sell-offs. This triggered a fall in the USDJPY to below 144, while the EURUSD continued its upward trend and the GBPUSD remained near 1.313.
On Thursday, August 5, the U.S. ADP National Employment Report for August came in at 99,000 jobs added, well below expectations (145,000), and the USDJPY continued its fall, temporarily reaching the upper 142 range. However, the U.S. ISM Non-Manufacturing PMI for August came in better than expected(51.1) at 51.5, sending the pair into a rebound to temporarily reach the upper 144 range. However, ongoing bearish pressure on the dollar sent the pair reversing downward once again.
On Friday, August 6, the high-profile U.S. August jobs report was released, with the number of nonfarm payrolls coming in below expectations(160,000) at 142,000, and data for June and July were also revised downward. This set off dollar bears when combined with a fall in U.S. Treasury yields, sending the USDJPY in freefall to as far as the 141 range. Both the EURUSD and GBPUSD marked new highs, albeit short-lived ones, and the dollar weakened sharply.
Economic Indicators and Statements to Watch this Week
(All times are in GMT)
September 9 (Mon)
23:50 (Sunday night), Japan: April-June quarterly real gross domestic product (revised GDP)
September 11 (Wed)
06:00, U.K.: July monthly gross domestic product (GDP, month-on-month data)
12:30, U.S.: August Consumer Price Index (CPI)
12:30, U.S.: August Consumer Price Index (CPI core index)
September 12 (Thu)
12:15, Europe: European Central Bank (ECB) Governing Council policy interest rate announcement
12:45, Europe: Regular press conference by European Central Bank (ECB) President Christine Lagarde
With the release of the U.S. Consumer Price Index (CPI) for August scheduled for this week, attention will be focused on the extent of the interest rate cut at the September FOMC meeting. Although the market is expecting a 0.25% rate cut, depending on economic indicators, the possibility of a 0.50% rate cut may intensify.
This Week's Forecast
The following currency pair charts are analyzed using an overlay of the ±1 and ±2 standard deviation Bollinger Bands, with a period of 20 days.
USDJPY
In the past trading week, the USDJPY fell from above 147 to below 142, a fall intermittently affected by economic indicator releases. In the coming week, as mentioned earlier, the U.S. CPI is due to release on Thursday, and depending on the results, the pair could move below 140.
Next is an analysis of the USDJPY daily chart.
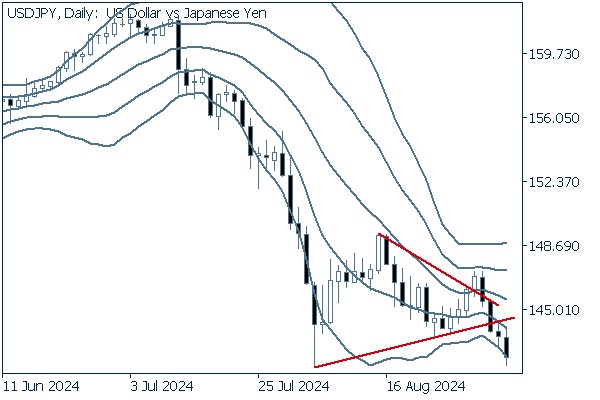

The pair appears to have begun a descending bandwalk with a break below the lower edge of its triangle formation. A sell-driven strategy appears to be sufficiently justified.
We continue with an analysis of the USDJPY weekly chart.
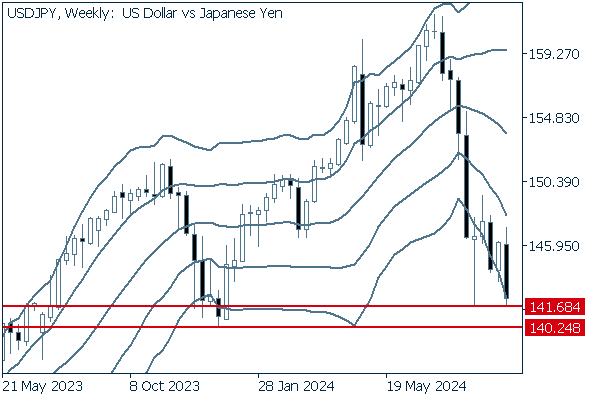

The pair is breaking below its most recent low of 141.68, and further decline is expected if it also breaks below the earlier low of 140.24.
Also, a weekly descending bandwalk may have begun, offering the likely conclusion that selling pressure is stronger here as well.
EURUSD
Any weakness in the dollar is being sharply highlighted in currency trading, indicating that it may be wise to target trading with the expectation that bearish pressure on the dollar will generally result in a rising EURUSD.
Next is an analysis of the EURUSD daily chart.
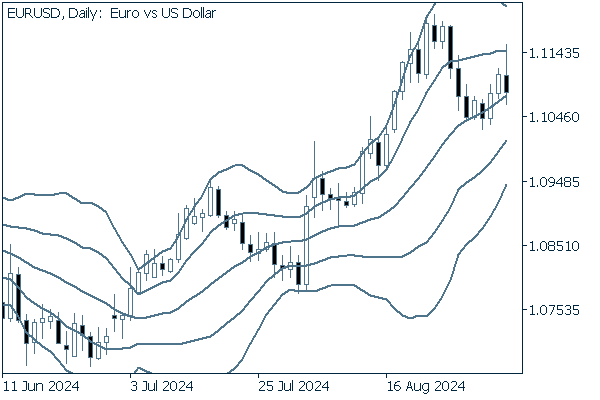

The pair has diverted from its ascending bandwalk to break below the +1 standard deviation Bollinger Band. However, the pair has bounced off the middle line to return to an ascending orientation. This could be interpreted as the downward adjustment momentum having been weak.
We continue with an analysis of the EURUSD weekly chart.
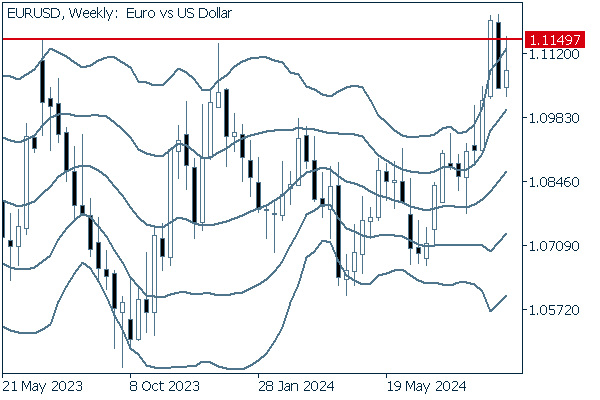

Though the pair broke above the resistance line of 1.1149, it fell back below to trade inside a range the following week, and then touched the line in the most recent trading week but fell back to leave an upper whisker.
Since we can draw the conclusion, at least within this timeframe, that upward momentum has been sapped, the key point will be whether the pair can cross this resistance line again.
GBPUSD
As with the EURUSD, a weakening dollar will be a compelling bullish factor for the GBPUSD.
Here is our analysis of the daily GBPUSD chart.
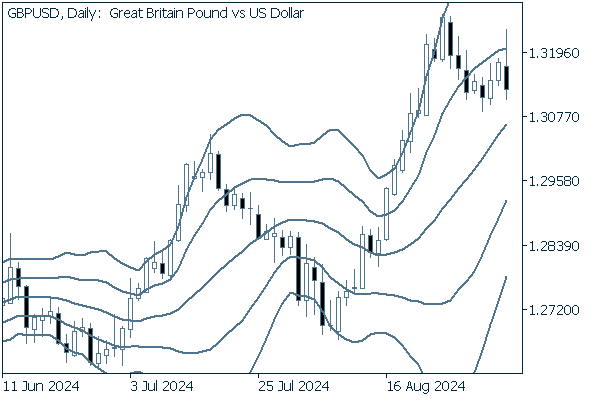

Like the EURUSD, this pair has ended an ascending bandwalk to break below the +1 standard deviation Bollinger Band. However, the GBPUSD deviates in that it has oscillated just below this band without reaching the middle line.
We continue with an analysis of the GBPUSD weekly chart.
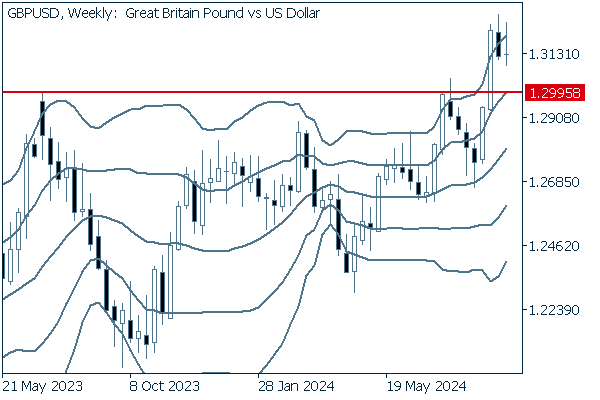

Since the price has broken above the resistance line just below 1.30 and has lingered at this position above the former resistance, a long-term continuation of the uptrend is possible.
Was this article helpful?
0 out of 0 people found this article helpful.
Thank you for your feedback.
FXON uses cookies to enhance the functionality of the website and your experience on it. This website may also use cookies from third parties (advertisers, log analyzers, etc.) for the purpose of tracking your activities. Cookie Policy
