2024.09.02
- Features
-
Services/ProductsServices/ProductsServices/Products

Learn more about the retail trading conditions, platforms, and products available for trading that FXON offers as a currency broker.
You can't start without it.
Trading Platforms Trading Platforms Trading Platforms
Features and functionality comparison of MetaTrader 4/5, and correspondence table of each function by OS
Two account types to choose
Trading Account Types Trading Account Types Trading Account Types
Introducing FXON's Standard and Elite accounts.
close close

-
SupportSupportSupport

Support information for customers, including how to open an account, how to use the trading tools, and a collection of QAs from the help desk.
Recommended for beginner!
Account Opening Account Opening Account Opening
Detailed explanation of everything from how to open a real account to the deposit process.
MetaTrader4/5 User Guide MetaTrader4/5 User Guide MetaTrader4/5 User Guide
The most detailed explanation of how to install and operate MetaTrader anywhere.
FAQ FAQ FAQ
Do you have a question? All the answers are here.
Coming Soon
Glossary Glossary GlossaryGlossary of terms related to trading and investing in general, including FX, virtual currencies and CFDs.
News News News
Company and License Company and License Company and License
Sitemap Sitemap Sitemap
Contact Us Contact Us Contact Us
General, personal information and privacy inquiries.
close close

- Promotion
- Trader's Market
- Partner
-
close close
Learn more about the retail trading conditions, platforms, and products available for trading that FXON offers as a currency broker.
You can't start without it.
Features and functionality comparison of MetaTrader 4/5, and correspondence table of each function by OS
Two account types to choose
Introducing FXON's Standard and Elite accounts.
Support information for customers, including how to open an account, how to use the trading tools, and a collection of QAs from the help desk.
Recommended for beginner!
Detailed explanation of everything from how to open a real account to the deposit process.
The most detailed explanation of how to install and operate MetaTrader anywhere.
Do you have a question? All the answers are here.
Coming Soon
Glossary of terms related to trading and investing in general, including FX, virtual currencies and CFDs.
General, personal information and privacy inquiries.
Useful information for trading and market information is posted here. You can also view trader-to-trader trading performance portfolios.
Find a trading buddy!
Share trading results among traders. Share operational results and trading methods.
- Legal Documents TOP
- Client Agreement
- Risk Disclosure and Warning Notice
- Order and Execution Policy
- Complaints Procedure Policy
- AML/CFT and KYC Policy
- Privacy Policy
- eKYC Usage Policy
- Cookies Policy
- Website Access and Usage Policy
- Introducer Agreement
- Business Partner Agreement
- VPS Service Terms and Condition

This article was :
published
updated
Weekly FX Market Review and Key Points for the Week Ahead
In the trading week ended September 1, the weakening trend of the dollar paused, and dollar buying regained momentum.
At the beginning of the week, the USDJPY briefly dipped to the mid-143 range but was subsequently bought, recovering to around 146. Similarly, the EURUSD pair briefly reached the 1.12 mark before being pushed back to the 1.10 level.
Toward the end of the week, stronger dollar buying emerged in response to the release of U.S. economic indicators.
On Monday, August 26, the USDJPY opened around the 143 level, following comments by Federal Reserve Chairman Jerome Powell the previous week. Powell's remark that "it is time to adjust monetary policy" hinted at a potential rate cut, leading the market to sell off the dollar.
As a result, the USDJPY was temporarily pushed down to the low 143 range at the start of the week but recovered to the 145 level by Tuesday, August 27.
On Wednesday, August 28, demand for the dollar temporarily strengthened, pushing it above the 145 level. However, lacking a clear sense of direction, it was soon pushed back to the mid-144 range.
On Thursday, April 29, the U.S. revised quarterly real gross domestic product (GDP) for the April-June period was released, showing an annualized quarter-on-quarter rate of 3.0%, surpassing the forecast of 2.8%.
This led to a temporary boost in dollar buying, with the USDJPY rallying to the mid-145 range. However, despite the strong economic indicators, the gains were limited, and the dollar fell back to the upper 144 range toward the end of the week.
On Friday, July 30, the U.S. personal consumption expenditures (PCE) deflator for July was released, and the results were generally in line with expectations. This led to a recovery in the USDJPY, bringing it back to the 146 level.
Regarding the EURUSD, the August Harmonised Index of Consumer Prices (HICP) was released at 2.2% year-on-year, meeting expectations. This prompted a sell-off of the euro, and combined with the dollar's strength, led to a decline in the EURUSD pair.
Additionally, the GBPUSD pair also fell back from its mid-week highs.
Economic Indicators and Statements to Watch this Week
(All times are in GMT)
September 3 (Tue)
14:00, U.S.: August ISM Manufacturing PMI
September 5 (Thu)
12:15, U.S.: August ADP National Employment Report
14:00, U.S.: August ISM Non-Manufacturing PMI (composite)
September 6 (Fri)
9:00, Europe: April-June Quarterly Regional Gross Domestic Product (GDP, finalized)
12:30, U.S.: August Change in Nonfarm Payrolls
12:30, U.S.: August Unemployment Rate
12:30, U.S.: August Average Hourly Earnings
With key economic indicators such as the August ISM Manufacturing PMI and the August U.S.National Employment Report set to be released this week, caution is advised. These indicators are expected to significantly influence the market, especially given the growing expectations of a rate cut at the upcoming FOMC meeting.
According to the CME FedWatch tool, there is a 70% probability of a 0.25% rate cut and a 30% probability of a 0.5% cut at the September 18 FOMC meeting. This represents a slight increase in the likelihood of a 0.25% cut compared to the previous week.
This Week's Forecast
The following currency pair charts are analyzed using an overlay of the ±1 and ±2 standard deviation Bollinger Bands, with a period of 20 days.
USDJPY
The USDJPY declined sharply in July and the first half of August, but recently, there has been a lack of clear direction, and the market is awaiting new developments.
This week, with the upcoming employment data and the change of the month, attention will be on whether a new trend will emerge.
Here is the daily analysis for the USDJPY.
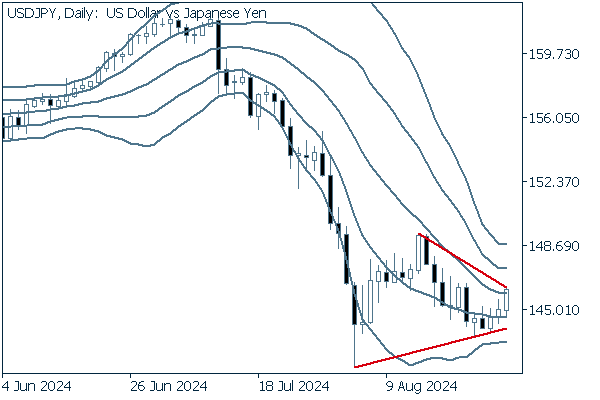

After the end of the descending bandwalk, the price is straddling the lower Bollinger Band, which is -1 standard deviation. Additionally, it has entered a triangular holding pattern, with highs falling and lows rising. It will be important to watch for a potential breakout from this pattern.
In market adjustment patterns such as flags and pennants,the basic principle is to assess whether the pattern will continue the previous trend or lead to a continuation of the previous decline, with the trend up to that point becoming the main trend. If the price falls below the -1 standard deviation level of the Bollinger Band again, a continuation of the decline may be possible.
Next, we will analyze the weekly trend of the USDJPY.
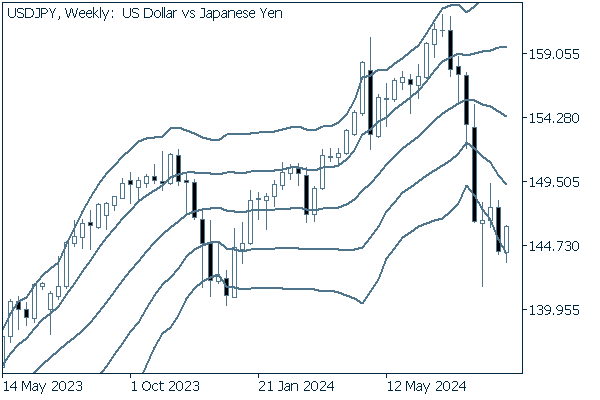

Since the price continues to hover around the -2 standard deviation level and the middle band is steadily declining, selling pressure appears strong on a weekly basis. A strategy to sell on a pullback to the -1 standard deviation level or the middle band could be considered.
EURUSD
Since the EURUSD does not have notable news driving its movements compared to the USDJPY, its price movements tend to be relatively modest and stable. It will primarily be affected by factors such as U.S. economic indicators and key figures' statements.
This week, with the Eurozone GDP and U.S. employment data scheduled for release, it's important to monitor dollar-denominated currency pairs like the EURUSD, in addition to yen-related pairs.
Here is an analysis of the daily chart for the EURUSD.
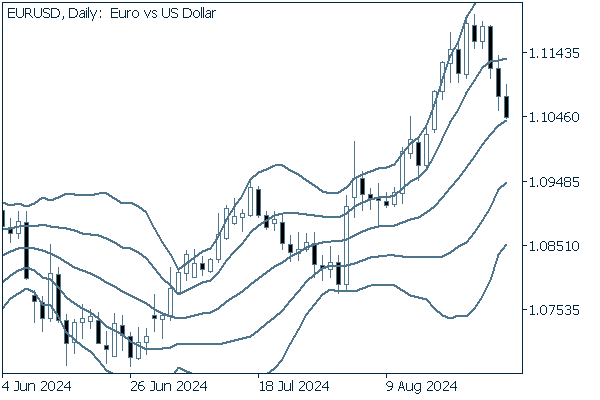

The price has closed below the +1 standard deviation level of the Bollinger Band, indicating that it is in an adjustment phase. There is a possibility that the price may decline from above the middle band to the -2 standard deviation area.
Next, we will analyze the weekly trend of the EURUSD.
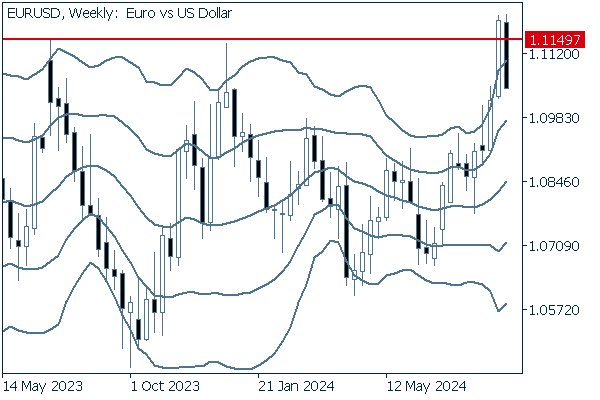

Although the price closed above the 2023 high of 1.11497, it was quickly pushed back below this level by the end of the session. This suggests that the recent rise may be short-lived, and the price could revert to fluctuating within the established range.
GBPUSD
While the GBPUSD shows a similar pattern to the EURUSD, it appears to be experiencing more bullish momentum.
Let's examine the daily chart for the GBPUSD.
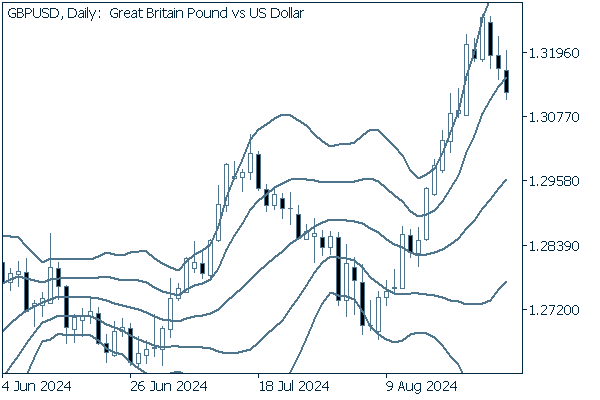

Following the upward bandwalk, Friday's decline has pushed the price below the +1 standard deviation level. If the price continues to adjust, the key point to watch is whether it will approach the middle band.
We will now review the weekly trend for the GBPUSD.
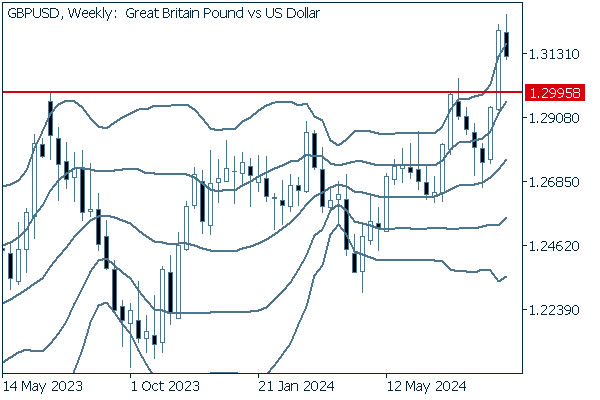

In contrast to the EURUSD, the chart for the GBPUSD remains above the 2023 high, indicating potential for continued growth.
Was this article helpful?
0 out of 0 people found this article helpful.
Thank you for your feedback.
FXON uses cookies to enhance the functionality of the website and your experience on it. This website may also use cookies from third parties (advertisers, log analyzers, etc.) for the purpose of tracking your activities. Cookie Policy
