2024.09.16
- Features
-
Services/ProductsServices/ProductsServices/Products

Learn more about the retail trading conditions, platforms, and products available for trading that FXON offers as a currency broker.
You can't start without it.
Trading Platforms Trading Platforms Trading Platforms
Features and functionality comparison of MetaTrader 4/5, and correspondence table of each function by OS
Two account types to choose
Trading Account Types Trading Account Types Trading Account Types
Introducing FXON's Standard and Elite accounts.
close close

-
SupportSupportSupport

Support information for customers, including how to open an account, how to use the trading tools, and a collection of QAs from the help desk.
Recommended for beginner!
Account Opening Account Opening Account Opening
Detailed explanation of everything from how to open a real account to the deposit process.
MetaTrader4/5 User Guide MetaTrader4/5 User Guide MetaTrader4/5 User Guide
The most detailed explanation of how to install and operate MetaTrader anywhere.
FAQ FAQ FAQ
Do you have a question? All the answers are here.
Coming Soon
Glossary Glossary GlossaryGlossary of terms related to trading and investing in general, including FX, virtual currencies and CFDs.
News News News
Company and License Company and License Company and License
Sitemap Sitemap Sitemap
Contact Us Contact Us Contact Us
General, personal information and privacy inquiries.
close close

- Promotion
- Trader's Market
- Partner
-
close close
Learn more about the retail trading conditions, platforms, and products available for trading that FXON offers as a currency broker.
You can't start without it.
Features and functionality comparison of MetaTrader 4/5, and correspondence table of each function by OS
Two account types to choose
Introducing FXON's Standard and Elite accounts.
Support information for customers, including how to open an account, how to use the trading tools, and a collection of QAs from the help desk.
Recommended for beginner!
Detailed explanation of everything from how to open a real account to the deposit process.
The most detailed explanation of how to install and operate MetaTrader anywhere.
Do you have a question? All the answers are here.
Coming Soon
Glossary of terms related to trading and investing in general, including FX, virtual currencies and CFDs.
General, personal information and privacy inquiries.
Useful information for trading and market information is posted here. You can also view trader-to-trader trading performance portfolios.
Find a trading buddy!
Share trading results among traders. Share operational results and trading methods.
- Legal Documents TOP
- Client Agreement
- Risk Disclosure and Warning Notice
- Order and Execution Policy
- Complaints Procedure Policy
- AML/CFT and KYC Policy
- Privacy Policy
- eKYC Usage Policy
- Cookies Policy
- Website Access and Usage Policy
- Introducer Agreement
- Business Partner Agreement
- VPS Service Terms and Condition

This article was :
published
updated
Weekly FX Market Review and Key Points for the Week Ahead
The trading week ended September 15 was largely aimless when it came to currency markets, highlighted by jittery dollar swings with a slight depreciative bias.
In particular, the market was influenced by observations on the range of interest rate cuts ahead of the U.S. FOMC meeting. Dollar bulls prevailed in the first half of the week, but this momentum shifted into bearish favor toward the second half of the week, sending the USDJPY to its lowest level since lows around the New Year. In the market, monetary policy developments in Japan and the U.S. continued to attract attention.
Let's review the market movements through the week.
September 9 (Mon)
The USDJPY started the week in the low 142 range after wild swings following the U.S. August employment data released at the end of the prior week.The employment report showed that average hourly earnings exceeded expectations, but the number of nonfarm payrolls fell short of expectations. This led to strong dollar buying immediately after the release, which would then reverse into dollar selling.
On the same day, Japan's revised real GDP for the April-June quarter was released. This data came in lower than expected at an annualized rate of 2.9%, elevating the USDJPY temporarily to the upper 143 range. However, the pair was later pushed back down to break below 143.
September 10 (Tue)
There were no major indicators released on the day, and the USDJPY tracked an unsteady course. With ongoing market speculation about the U.S. interest rate policy, the USDJPY briefly rose to the upper 143 range, but then fell back below 143 once again.
September 11 (Wed)
In a speech, Bank of Japan monetary policy board member Junko Nakagawa mentioned the possibility of adjusting the degree of monetary easing if progress is made in the economic and price outlook, which strengthened speculation of a rate hike.
This caused a sharp drop in the USDJPY, temporarily sending it as far as 140.70. However, the subsequent release of the U.S. Consumer Price Index (CPI core index) for August, which exceeded the forecast with 0.3% growth month on month, softened expectations of a significant U.S. interest rate cut, and dollar buying strengthened once again.This lifted the USDJPY to the mid-142 range.
September 12 (Thu)
The USDJPY briefly rose to above 143 on Thursday, but dollar selling intensified after the Wall Street Journal reported that Fed officials were undecided whether to cut rates by 0.25% or 0.50% at the coming week's FOMC meeting.Following the news report, the USDJPY once again entered a downtrend, and uncertainty spread among the market about the extent of the rate cut ahead of the FOMC meeting to be held over the weekend.
Also on this day, the European Central Bank (ECB) cut interest rates by 0.25%, which was in line with market expectations and did not cause much disruption to the EURUSD pair.
September 13 (Fri)
There were no major indicators released on this day, but dollar selling continued as investors became aware of the possibility of a 0.50% rate cut at the FOMC meeting. The market continued to trade cautiously, with attention focused on the coming FOMC meeting.
The coming week marks a number of important events coming up, including the U.S. release of August retail sales, the U.S. FOMC meeting, and the Bank of Japan's monetary policy meeting. In particular, if the FOMC decides to cut rates by 0.50%, dollar selling pressure could be further intensified, requiring vigilance among traders against sudden market shifts. The Bank of Japan's policy decisions will also be a factor that will affect the yen's exchange rate, so attention will continue to focus on these with respect to USDJPY movement.
Economic Indicators and Statements to Watch this Week
(All times are in GMT)
September 17 (Tue)
12:30, U.S.: August retail sales
12:30, U.S.: August retail sales (excluding automobiles)
September 18 (Wed)
09:00, Europe: August Harmonised Index of Consumer Prices (revised HICP)
09:00, Europe: August Harmonised Index of Consumer Prices (revised HICP core index)
18:00, U.S.: Federal Reserve Open Market Committee (FOMC) meeting, post-meeting policy rate announcement
18:30 U.S.: Regular press conference by Federal Reserve Chairman Jerome Powell
September 19 (Thu)
11:00, U.K.: Bank of England (BOE) policy interest rate announcement
11:00, U.K.: Bank of England Monetary Policy Committee (MPC) meeting
23:30, Japan: August Consumer Price Index, Japan (CPI, all items)
23:30, Japan: August Consumer Price Index, Japan (CPI, all items less fresh food)
September 20 (Fri)
TBA Japan: Bank of Japan Monetary Policy Meeting, post-meeting policy rate announcement
06:30, Japan: Regular press conference by Bank of Japan Governor Kazuo Ueda
This Week's Forecast
The following currency pair charts are analyzed using an overlay of the ±1 and ±2 standard deviation Bollinger Bands, with a period of 20 days.
USDJPY
With the pair breaking into year-to-date lows from last week's price movements, and with several important economic events scheduled for this week involving the dollar and the yen, the pair could nervously swing up and down or even mark deeper lows.
Next is an analysis of the USDJPY daily chart.
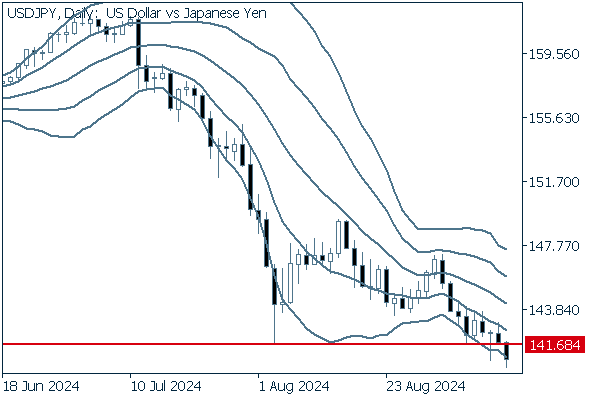

Since the low at 141.68 was broken at the close on Friday, the next step is to consider a strategy anticipating a transition from support to resistance at the 141.68 line.
We continue with an analysis of the USDJPY weekly chart.
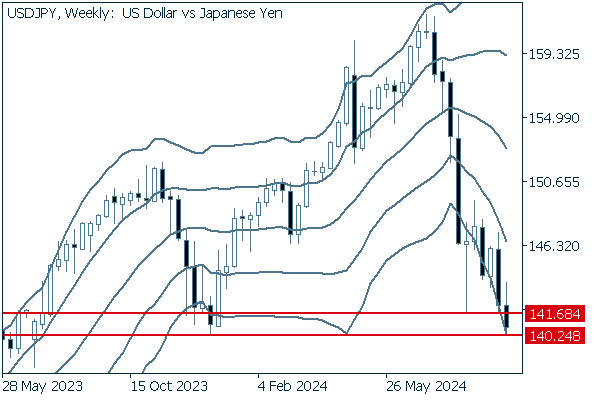

The most recent week's decline has brought the pair within striking distance of another longstanding low at 140.24. If the price falls below this line, a bearish run all the way to 130 level could be imminent.
EURUSD
As of the new rate cut, the euro's policy rate is now 3.65%. Weakness in the dollar evidenced by the decline in the USDJPY could persist, potentially sending the EURUSD into a corresponding uptrend.
Next is an analysis of the EURUSD daily chart.
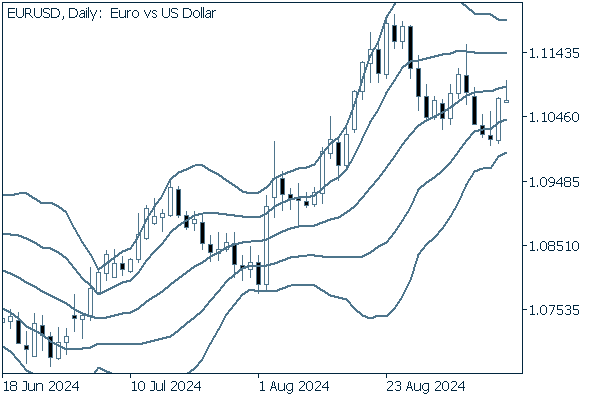

The pair has exited its upward bandwalk and broken below the +1 standard deviation Bollinger Band to enter a downtrend.
The pair is demonstrating wide swings, so there's a fairly high possibility that this is a corrective decline, Traders may consider strategizing for a return to an uptrend.
We continue with an analysis of the EURUSD weekly chart.
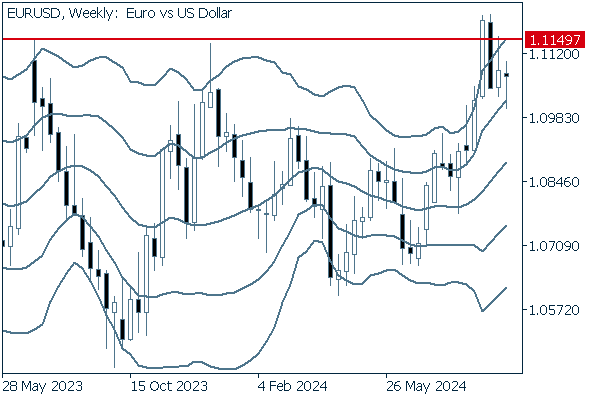

The pair continues to trade below the notable 1.1149 high level, which will be of great attention for bull traders.
GBPUSD
This week, the Bank of England will announce its policy rate for the pound, which is expected to remain unchanged at 5.0%.
Now, we analyze the daily GBPUSD chart.
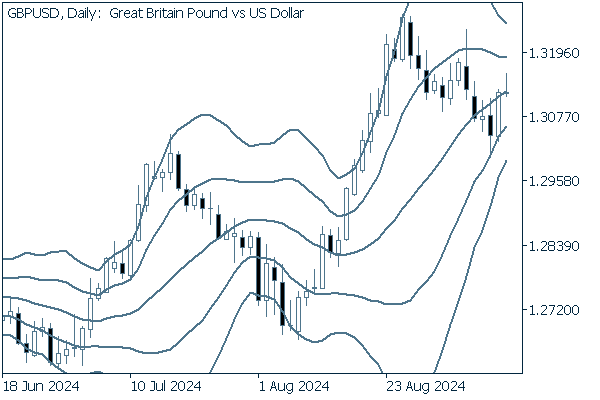

In what appears to have been a declining adjustment after an uptrend, the pair broke below the middle line and rebounded off the -1 standard deviation Bollinger Band.
Sufficiently powerful upward pressure could restore the pair to the currently mainstream wisdom of upward momentum.
We continue with an analysis of the GBPUSD weekly chart.
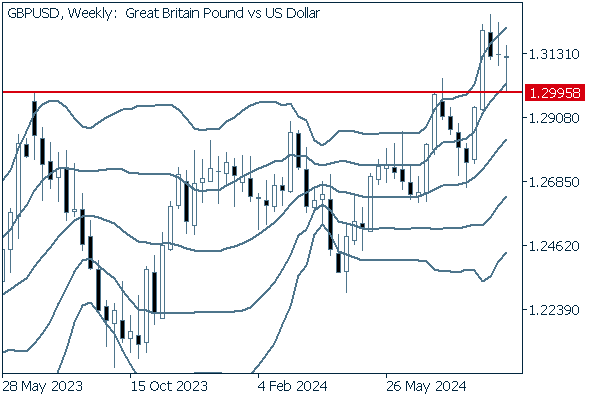

The decline in the most recent week reveals that the 1.2995 line, broken above as a resistance, now functions as a support. In the longer term, a bullish sentiment appears justified.
Was this article helpful?
0 out of 0 people found this article helpful.
Thank you for your feedback.
FXON uses cookies to enhance the functionality of the website and your experience on it. This website may also use cookies from third parties (advertisers, log analyzers, etc.) for the purpose of tracking your activities. Cookie Policy
