2024.08.26
- Features
-
Services/ProductsServices/ProductsServices/Products

Learn more about the retail trading conditions, platforms, and products available for trading that FXON offers as a currency broker.
You can't start without it.
Trading Platforms Trading Platforms Trading Platforms
Features and functionality comparison of MetaTrader 4/5, and correspondence table of each function by OS
Two account types to choose
Trading Account Types Trading Account Types Trading Account Types
Introducing FXON's Standard and Elite accounts.
close close

-
SupportSupportSupport

Support information for customers, including how to open an account, how to use the trading tools, and a collection of QAs from the help desk.
Recommended for beginner!
Account Opening Account Opening Account Opening
Detailed explanation of everything from how to open a real account to the deposit process.
MetaTrader4/5 User Guide MetaTrader4/5 User Guide MetaTrader4/5 User Guide
The most detailed explanation of how to install and operate MetaTrader anywhere.
FAQ FAQ FAQ
Do you have a question? All the answers are here.
Coming Soon
Glossary Glossary GlossaryGlossary of terms related to trading and investing in general, including FX, virtual currencies and CFDs.
News News News
Company and License Company and License Company and License
Sitemap Sitemap Sitemap
Contact Us Contact Us Contact Us
General, personal information and privacy inquiries.
close close

- Promotion
- Trader's Market
- Partner
-
close close
Learn more about the retail trading conditions, platforms, and products available for trading that FXON offers as a currency broker.
You can't start without it.
Features and functionality comparison of MetaTrader 4/5, and correspondence table of each function by OS
Two account types to choose
Introducing FXON's Standard and Elite accounts.
Support information for customers, including how to open an account, how to use the trading tools, and a collection of QAs from the help desk.
Recommended for beginner!
Detailed explanation of everything from how to open a real account to the deposit process.
The most detailed explanation of how to install and operate MetaTrader anywhere.
Do you have a question? All the answers are here.
Coming Soon
Glossary of terms related to trading and investing in general, including FX, virtual currencies and CFDs.
General, personal information and privacy inquiries.
Useful information for trading and market information is posted here. You can also view trader-to-trader trading performance portfolios.
Find a trading buddy!
Share trading results among traders. Share operational results and trading methods.
- Legal Documents TOP
- Client Agreement
- Risk Disclosure and Warning Notice
- Order and Execution Policy
- Complaints Procedure Policy
- AML/CFT and KYC Policy
- Privacy Policy
- eKYC Usage Policy
- Cookies Policy
- Website Access and Usage Policy
- Introducer Agreement
- Business Partner Agreement
- VPS Service Terms and Condition

This article was :
published
updated
Weekly FX Market Review and Key Points for the Week Ahead
Currency markets in the trading week ended August 25th saw the dollar weaken against the yen, with the USDJPY oscillating as it tracked a downward path.
The USDJPY opened the week on Monday, August 19 in the upper 147 level due to lower U.S. long-term interest rates and position adjustments at the end of the previous week. Then, with the Nikkei 225 index falling and the market as a whole becoming more risk averse, dollar bears and yen bulls prevailed, sending the pair temporarily falling to the low 145 level.
On Tuesday, August 20, the Nikkei 225's recovery helped send the USDJPY back up to the low 147 level, but the pair then once again fell below 146 due to declines in the U.S. and European stock markets and another drop in U.S. long-term interest rates.
On Wednesday the 21st, the market entered a state of alarm after reports of potentially sharp downward revision to the U.S. Labor Department's annual employment statistics for the period from April 2023 to March 2024.
This was exacerbated by comments in the new Federal Open Market Committee (FOMC) minutes release, including that it would be appropriate to begin cutting interest rates from September. This sent the USDJPY falling from the high 146 range to the low 144 range on that day.
On Thursday the 22nd, the USDJPY temporarily rebounded to the mid-146 level amid a firm trend in the Nikkei 225, but on Friday the 23rd, the pair was pushed back to the low 145 level again.
On the same day, Bank of Japan Governor Kazuo Ueda stated in a response during intensive deliberations at a closed session of the Japanese Diet that the BOJ would continue its stance toward monetary normalization.
In addition, Federal Reserve Chairman Jerome Powell's speech at the Jackson Hole Symposium included an explicit statement saying that interest rates would be cut. This suggested that a monetary policy adjustment was imminent and added to dollar selling pressure.
Though the USDJPY significantly oscillated through the past week, the overall trend continued to be bearish. Looking ahead, the focus will be on how large the rate cut will be at the upcoming September FOMC meeting.
According to the CME FedWatch tool, a rate cut is a foregone conclusion, with a 100% chance of a rate cut at the September meeting. More notable is the expectation on the size of the cut, with a 76% chance of a 25 basis point cut and a 24% chance of a 50 basis point cut, indicating stronger support for a slow tick downward.
In the coming week, the focus will be on whether economic indicators such as the U.S. personal consumption expenditures (PCE) release for July will further fuel dollar selling.
The past week also saw the weaker dollar send the EURUSD and GBPUSD rising at a consistent pace. In particular, the Eurozone's Harmonised Index of Consumer Prices (HICP) was in line with expectations, which supported a steady uptrend in the EURUSD.
As mentioned in the chart commentary below, the EURUSD and GBPUSD have broken past long-term milestone highs and may move further higher as the dollar weakens.
Economic Indicators and Statements to Watch this Week
(All times are in GMT)
August 29 (Thu)
12:30, U.S.: April-June quarterly real gross domestic product (revised GDP, quarter-on-quarter annualized data)
August 30 (Fri)
09:00, Europe: August Harmonised Index of Consumer Prices (preliminary HICP, year-on-year data)
09:00, Europe: August Harmonised Index of Consumer Prices (preliminary HICP core index, year-on-year data)
12:30, U.S.: July personal consumption expenditures (PCE deflator, year-on-year data)
12:30, U.S.: July personal consumption expenditures (core PCE deflator, excluding food and energy)
This Week's Forecast
The following currency pair charts are analyzed using an overlay of the ±1 and ±2 standard deviation Bollinger Bands, with a period of 20 days.
USDJPY
The pair is poised to move not based on the rate cut itself in September, but rather how extensive the rate cut will be.
Since there is little bullish logic for the dollar and dominant bearish logic, a long-term selling trend for the dollar (i.e., bearish USD/JPY and bullish EURUSD and GBPUSD) seems likely.
Next is an analysis of the USDJPY daily chart.
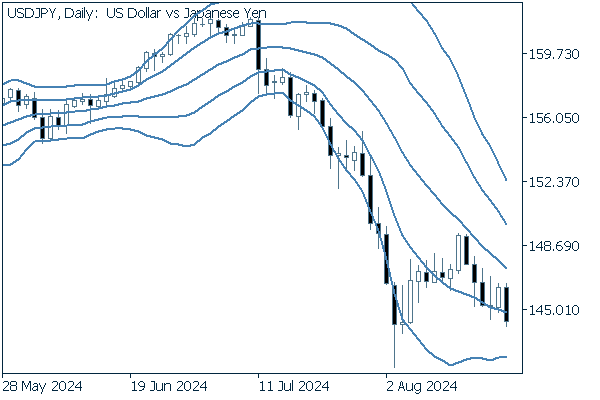

After a quick plunge below the -2 standard deviation Bollinger Band, the pair effected a rebound and has entered a nervous upward adjustment phase. Since the price has failed to maintain momentum to climb above the middle line, a continued presence below the middle line (even if above the -1 standard deviation band) could build a case for a stunted rebound and a return to a bear trend.
We continue with an analysis of the USDJPY weekly chart.
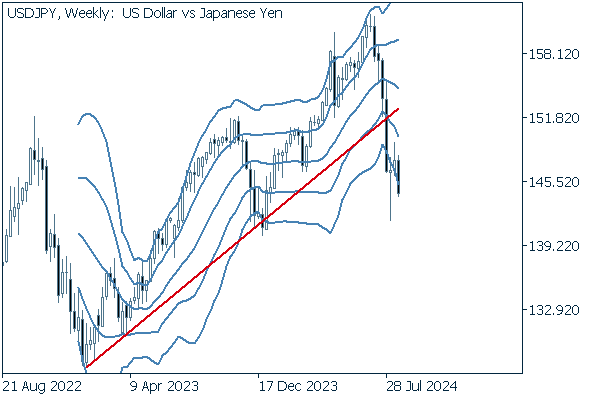

The weekly chart also shows sell-side momentum, with the pair cleanly breaking below the trendline drawn from 2022 levels without returning to the vicinity of that line.
We can see prices moving between the -1 and -2 standard deviation Bollinger Bands already, which may be the initial state of a descending bandwalk.
EURUSD
With a July HICP release in line with expectations, the euro has no major logic for either the buy or sell side; this opens the door to a rising EURUSD due to dollar selling pressure.
Next is an analysis of the EURUSD daily chart.
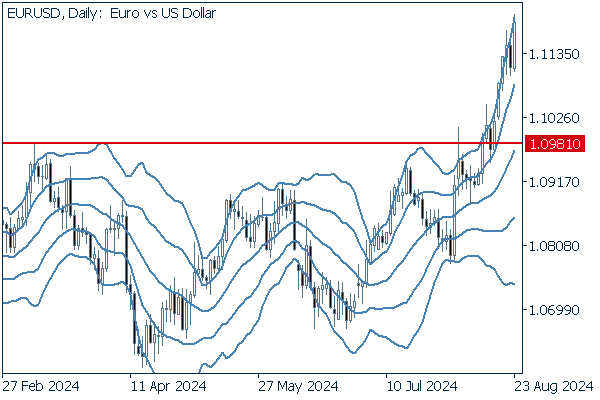

The formerly staunch resistance line at 1.09810, the high from earlier this year, has been successfully broken above after multiple attempts to clear the line, with the pair now entering an ascending bandwalk.
We continue with an analysis of the EURUSD weekly chart.
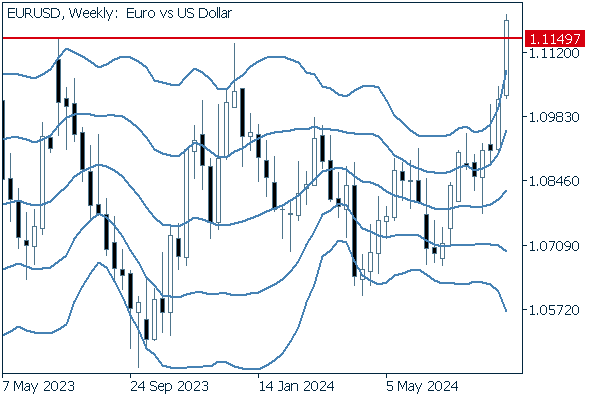

The weekly chart also shows a promising upside scenario with the pair closing above last year's high of 1.11497 in the most recent trading week.
GBPUSD
The pound has no strong releases driving buy or sell logic in the upcoming week. This suggests it may be worth pursuing a bullish position with the GBPUSD on the back of a weakening dollar.
Now, we analyze the daily GBPUSD chart.
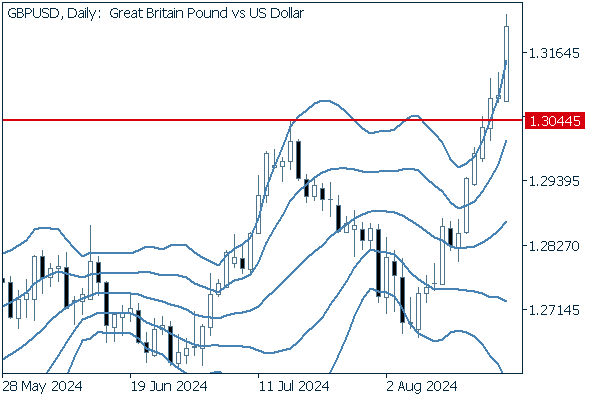

The pair has clearly and resolutely surpassed its recent high of 1.30445. The fact that the usual psychological resistance posed by a round number price level like 1.3 did not seem to faze this rise shows the strength of the pair's bullish momentum.
We continue with an analysis of the GBPUSD weekly chart.
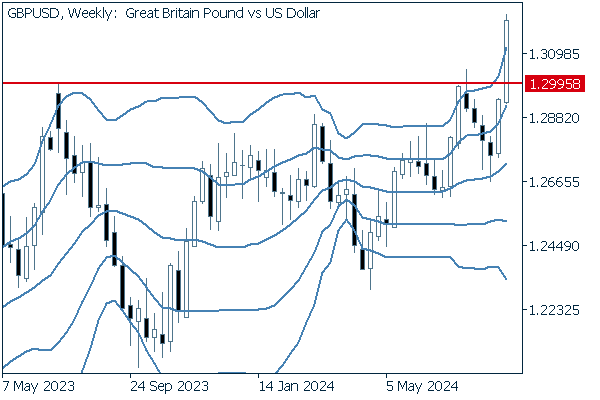

The chart shows a break well above last spring's high of 1.29958.
Naturally, there is the potential that this is a false breakout, but given that the pair has climbed above a key long-term line, a bullish position seems justified.
Was this article helpful?
0 out of 0 people found this article helpful.
Thank you for your feedback.
FXON uses cookies to enhance the functionality of the website and your experience on it. This website may also use cookies from third parties (advertisers, log analyzers, etc.) for the purpose of tracking your activities. Cookie Policy
