2024.08.12
- Features
-
Services/ProductsServices/ProductsServices/Products

Learn more about the retail trading conditions, platforms, and products available for trading that FXON offers as a currency broker.
You can't start without it.
Trading Platforms Trading Platforms Trading Platforms
Features and functionality comparison of MetaTrader 4/5, and correspondence table of each function by OS
Two account types to choose
Trading Account Types Trading Account Types Trading Account Types
Introducing FXON's Standard and Elite accounts.
close close

-
SupportSupportSupport

Support information for customers, including how to open an account, how to use the trading tools, and a collection of QAs from the help desk.
Recommended for beginner!
Account Opening Account Opening Account Opening
Detailed explanation of everything from how to open a real account to the deposit process.
MetaTrader4/5 User Guide MetaTrader4/5 User Guide MetaTrader4/5 User Guide
The most detailed explanation of how to install and operate MetaTrader anywhere.
FAQ FAQ FAQ
Do you have a question? All the answers are here.
Coming Soon
Glossary Glossary GlossaryGlossary of terms related to trading and investing in general, including FX, virtual currencies and CFDs.
News News News
Company and License Company and License Company and License
Sitemap Sitemap Sitemap
Contact Us Contact Us Contact Us
General, personal information and privacy inquiries.
close close

- Promotion
- Trader's Market
- Partner
-
close close
Learn more about the retail trading conditions, platforms, and products available for trading that FXON offers as a currency broker.
You can't start without it.
Features and functionality comparison of MetaTrader 4/5, and correspondence table of each function by OS
Two account types to choose
Introducing FXON's Standard and Elite accounts.
Support information for customers, including how to open an account, how to use the trading tools, and a collection of QAs from the help desk.
Recommended for beginner!
Detailed explanation of everything from how to open a real account to the deposit process.
The most detailed explanation of how to install and operate MetaTrader anywhere.
Do you have a question? All the answers are here.
Coming Soon
Glossary of terms related to trading and investing in general, including FX, virtual currencies and CFDs.
General, personal information and privacy inquiries.
Useful information for trading and market information is posted here. You can also view trader-to-trader trading performance portfolios.
Find a trading buddy!
Share trading results among traders. Share operational results and trading methods.
- Legal Documents TOP
- Client Agreement
- Risk Disclosure and Warning Notice
- Order and Execution Policy
- Complaints Procedure Policy
- AML/CFT and KYC Policy
- Privacy Policy
- eKYC Usage Policy
- Cookies Policy
- Website Access and Usage Policy
- Introducer Agreement
- Business Partner Agreement
- VPS Service Terms and Condition

This article was :
published
updated
Weekly FX Market Review and Key Points for the Week Ahead
In the trading week ended August 11, the USDJPY pair demonstrated dramatic price fluctuations.
At the beginning of the week, the Bank of Japan appeared poised to make additional rate hikes continuing from the previous week, which, combined with weak U.S. employment data, sent the USDJPY to below 142 on an intraday basis early in trading Monday, August 5. The Nikkei 225 index also fell sharply and yen buyers made headway, resulting in a panicked market development.
However, the market quickly rebounded thereafter. Later, in the U.S. morning hours on Monday, the U.S. ISM Non-Manufacturing PMI for July was released. The data exceeded expectations, assuaging fears of a U.S. economic slowdown receded and giving momentum to dollar bulls.
On Wednesday, August 7 during Tokyo trading hours, Bank of Japan Deputy Governor Shinichi Uchida appeared to soften the BOJ's stance on rate hikes, saying there will be no increases in the interest rate while markets are unstable. This triggered yen sell-offs, pushing the USDJPY above 147.
The pair would then fluctuate wildly thereafter, after which it stabilized to recover above 147 once again on Thursday, August 8, when the number of new unemployment insurance claims in the U.S. fell more than expected, easing market fears about the U.S. economy. However, during New York trading hours on Friday, the USDJPY fell once again to break below 147.
The USDJPY would eventually close the week in the mid-146 range, nearly eliminating the sharp decline at the beginning of the week. Markets are especially volatile in their current state, and traders are urged to be watchful with regard to future developments.
Economic Indicators and Statements to Watch this Week
(All times are in GMT)
August 14 (Wed)
09:00, Europe: April-June quarterly regional gross domestic product (revised regional GDP, quarter-on-quarter data)
09:00, Europe: April-June quarterly regional gross domestic product (revised regional GDP, year-on-year data)
12:30, U.S.: July Consumer Price Index (CPI, month-on-month data)
12:30, U.S.: July Consumer Price Index (CPI, year-on-year data)
12:30, U.S.: July Consumer Price Index (CPI core index, month-on-month data)
12:30, U.S.: July Consumer Price Index (CPI core index, year-on-year data)
23:50, Japan: April-June quarterly real gross domestic product (preliminary GDP, quarter-on-quarter data)
23:50, Japan: April-June quarterly real gross domestic product (preliminary GDP, annualized data)
August 15 (Thu)
06:00, U.K.: April-June quarterly gross domestic product (preliminary GDP, quarter-on-quarter data)
06:00, U.K.: April-June quarterly gross domestic product (preliminary GDP, year-on-year data)
06:00, U.K.: June monthly gross domestic product (GDP, month-on-month data)
12:30, U.S.: July retail sales (month-on-month data)
12:30, U.S.: July retail sales (month-on-month data, excluding automobiles)
In the coming week, U.S. CPI and retail sales could again greatly influence the market. Any weak results from these releases would be expected to strengthen the trend toward greater yen appreciation.
This Week's Forecast
The following currency pair charts are analyzed using an overlay of the ±1 and ±2 standard deviation Bollinger Bands, with a period of 20 days.
USDJPY
It appears a safe bet to assume a dollar interest rate cut at the September 18 FOMC meeting, as the CME's FedWatch tool shows a 0% chance of an unchanged policy rate. In addition, it shows a 51.5% expectation of a 0.25% rate cut, and a 48.5% expectation of a 0.5% cut. One week ago, the 0.5% rate cut forecast was 26%, showing nearly doubled expectations in the past week.
Turning our attention to the yen, the BOJ's stance is somewhat ambiguous in contrast, and the already mentioned comments by Deputy Governor Uchida have somewhat dampened expectations of a rate hike. If the BOJ begins to demonstrate an appetite for a rate hike once again, it could synergize with the dollar rate cut expectations to drive an even more overwhelming decline in the USDJPY.
Next is an analysis of the USDJPY daily chart.
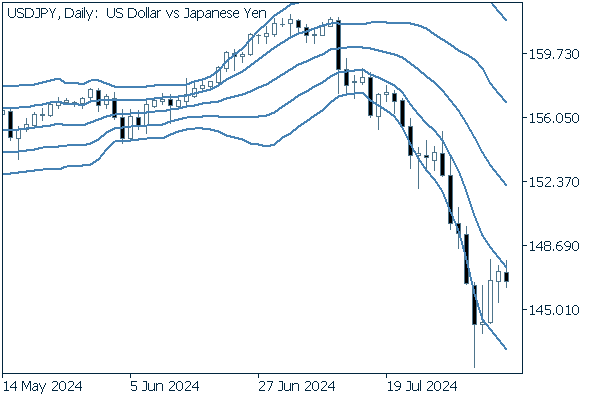

The pair continues its classic downward bandwalk, and even despite a rebound from Tuesday, the pair has not been able to rise above its -1 standard deviation Bollinger Band.
With the middle line also at a steep and steady decline, the chart offers a relatively safe bearish suggestion.
We continue with an analysis of the USDJPY weekly chart.
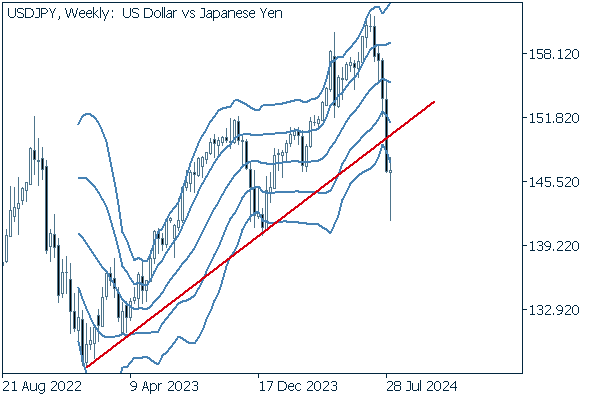

After closing below its uptrend line for the week before, the most recent week ended nearly flat, with a very long lower whisker.
Since the pair is below the -2 standard deviation Bollinger Band, it is not unreasonable to say its declines are overextended. However, with a steadily falling middle line, we can surmise that bearish pressure is strong over the long term.
EURUSD
On Wednesday, August 14, the Eurozone will release its quarterly regional gross domestic product for April to June. If this release contains no major surprises, it is unlikely that the EURUSD pair will experience severe price fluctuations as a result.
Next is an analysis of the EURUSD daily chart.
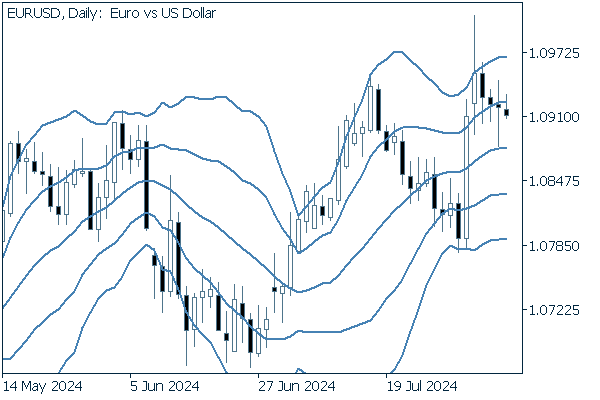

After briefly reaching 1.1 during last Monday's rally, the pair has since been inching its way down in a series of four consecutive negative closes. The daily chart demonstrates no clear trend, simply movements back and forth within a tight range.
We continue with an analysis of the EURUSD weekly chart.
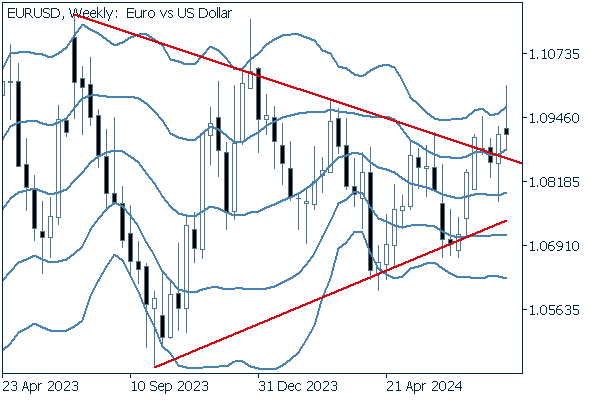

The pair managed to remain outside the triangle formation after a break above, and appears to be in a preparatory phase for a sustained rise. Attention will be on whether the pair can avoid a backslide.
GBPUSD
On Thursday the 15th, the U.K. will release its quarterly gross domestic product for April to June, as well as its monthly gross domestic product for June. However, the GBPUSD seems to be still largely influenced by movements in the dollar, rather than those of the pound.
Now, we analyze the daily GBPUSD chart.
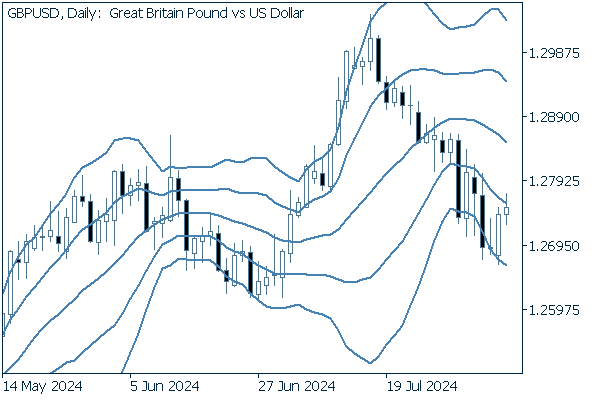

The pair has maintained a relatively constant downward pace, from as high as the +2 standard deviation Bollinger Band to reach as far as the -2 standard deviation band. It will be of great interest to see if the pair continues its downward bandwalk.
We continue with an analysis of the GBPUSD weekly chart.
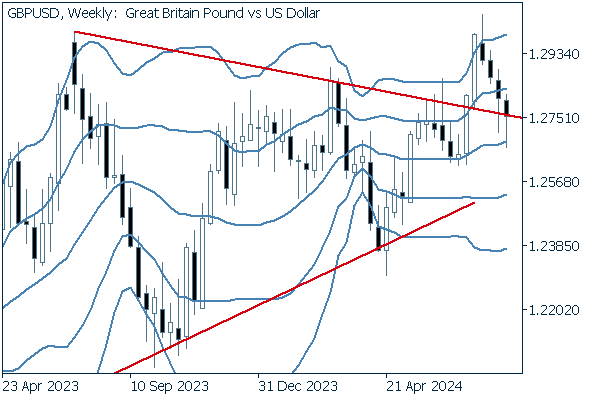

The pair retraced after a break above its triangle formation, falling below the upper boundary on an intraweek basis two weeks in a row to only leave lower whiskers after a rebound. If the pair can remain above this formation and not fall back inside, there is the potential of a reversal toward a bull trend.
Was this article helpful?
0 out of 0 people found this article helpful.
Thank you for your feedback.
FXON uses cookies to enhance the functionality of the website and your experience on it. This website may also use cookies from third parties (advertisers, log analyzers, etc.) for the purpose of tracking your activities. Cookie Policy
