2024.08.05
This article was :
published
updated
Weekly FX Market Review and Key Points for the Week Ahead
In the week ended August 4, yen bulls gained momentum to push the USDJPY sharply down to hit new lows.
At the Bank of Japan's monetary policy meeting on Wednesday, July 31, the policy rate was raised to 0.25% and the BOJ announced a plan to reduce future government bond purchases, as had been expected beforehand.
Governor Kazuo Ueda's press conference suggested the possibility of further interest rate hikes, leading to a hawkish impression in the market.
This announcement has led to a sharp rise in yen buying, sending the USDJPY plummeting below 150.
Later the same day, the U.S. Federal Open Market Committee (FOMC) also met, and although the policy rate was left unchanged as expected, Fed Chairman Jerome Powell hinted at a rate cut in September. This statement emboldened dollar bears, sending the USDJPY down further.
On Thursday, August 1, the U.K.'s Monetary Policy Committee (MPC) cut the policy rate for the pound by 0.25%. The decision was a close 5-4 vote, and Bank of England Governor Andrew Bailey acknowledged that it was a delicate decision. Although the market had factored in the rate cut to some extent, the pound had a bearish tilt already before the announcement, and the yen's appreciation was further accelerated through the decline of the GBPJPY.
Furthermore, the U.S. ISM Manufacturing PMI for July came in below expectations, further reinforcing risk-averse yen buying.
On Friday, August 2, the U.S. jobs report was released, with the nonfarm payrolls (NFP) figure falling far short of expectations, and unemployment showed a worsening trend. This result accelerated dollar selling, with the USDJPY falling sharply to as far as the mid-146 range.
In the eurozone, preliminary figures for quarterly gross regional product (GDP) in the April-June quarter were released on Tuesday, July 30. These were largely in line with expectations, leaving the EURUSD in a mostly flat trading pattern, though broadly affected by a weaker dollar.
In addition, on Wednesday, July 31, preliminary data were released for the eurozone's July Harmonised Index of Consumer Prices (HICP), showing 2.6% year-on-year growth beating an expected 2.5%. The core index also showed another better-than-expected result, at 2.9% versus a forecast of 2.8%.
Like the GBPJPY, the GBPUSD dropped through the week on the back of a weakening dollar.
Economic Indicators and Statements to Watch this Week
(All times are in GMT)
August 5 (Mon)
14:00, U.S.: July ISM Non-Manufacturing PMI (composite)
This Week's Forecast
The following currency pair charts are analyzed using an overlay of the ±1 and ±2 standard deviation Bollinger Bands, with a period of 20 days.
USDJPY
The USDJPY has been a nearly one-way downward street in the most recent trading week amid an appreciating yen versus a weakening dollar.
As we have reported, the September FOMC meeting appears to be the most likely timing for a dollar rate cut. The CME FedWatch tool and its 0% probability of an unchanged rate at the September FOMC meeting offers a clear picture that a rate cut is nearly a foregone conclusion. It is also important to note that there is now a 22% probability of a 0.5% interest rate cut per the tool, which is double the normal range.
With the Bank of Japan sniffing at further interest rate hikes, the current downtrend in the USDJPY has fundamental support. Strategies should focus first on following the bears, without stretching the imagination toward anticipating a market reversal.
Next is an analysis of the USDJPY daily chart.
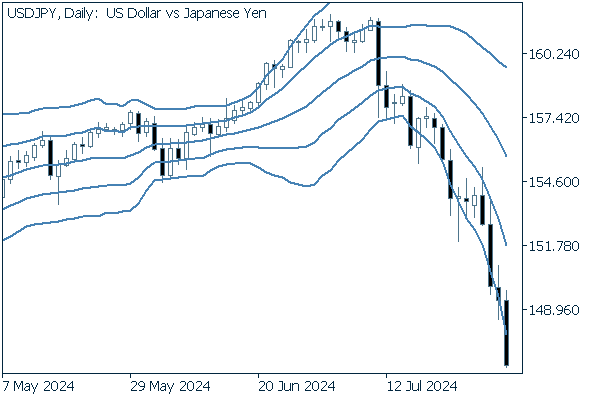
A downward bandwalk has already begun with the pair trading between the -1 and -2 standard deviation Bollinger Bands, and the pair has left four consecutive negative candles so far.
Compared to the bull market period, we can see overwhelmingly longer negative candles, demonstrating textbook price movements following the market theory of rising slowly and falling quickly.
We continue with an analysis of the USDJPY weekly chart.
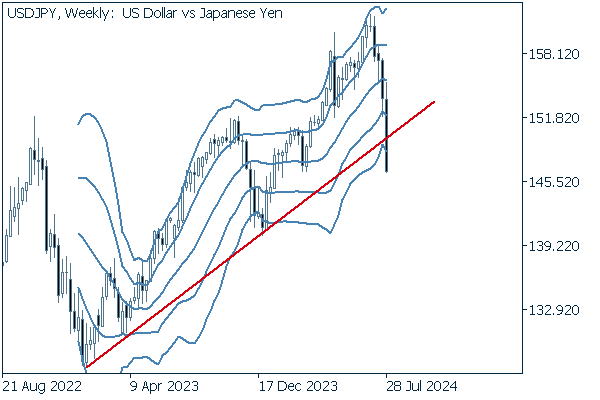
The pair has also closed below its weekly trend line.
Even at the weekly level, the momentum of the decline is evident with a series of four negative candles from recent highs.
EURUSD
The market plotted a nervously bearish course through Thursday, when an overwhelmingly weak dollar on Friday led to relative buying of the euro, leaving a long positive candle at the end of the week for the EURUSD.
Next is an analysis of the EURUSD daily chart.
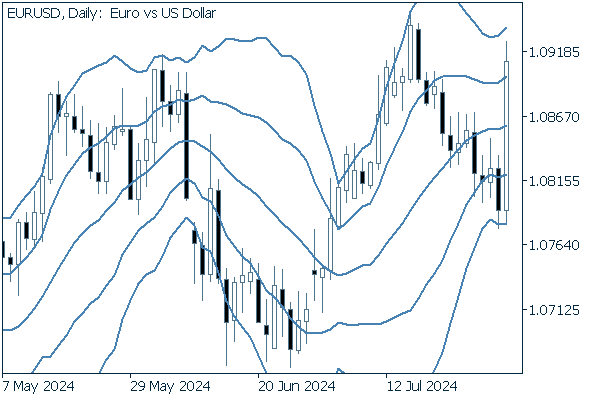
A long positive candle stick has reached nearly as far as recent highs, indicating a potential pause in the downward adjustments.
We continue with an analysis of the EURUSD weekly chart.
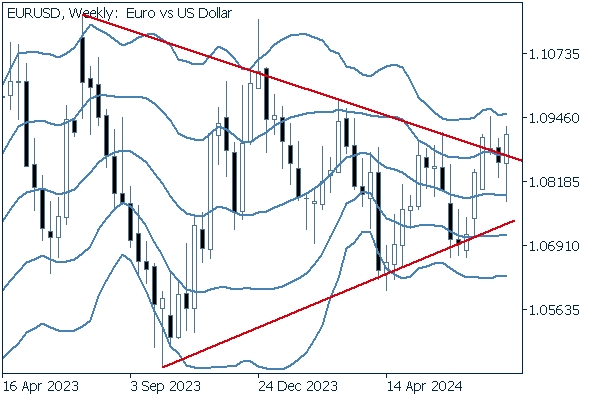
The pair continues to move aimlessly around the upper edge of the triangle formation.
Whether it breaks up or down, if the pair were to reach the +2 or -2 standard deviation Bollinger Bands, expect a full-scale trend to begin. Also, be sure to check each line of the Bollinger Bands, even if only occasionally, as a serious move will create a tilt in the middle line.
GBPUSD
Though there was an interest rate cut for the pound, as already mentioned, it was a delicate decision even among those involved.
In the upcoming week, there are no influential economic releases scheduled for the pound.
Now, we analyze the daily GBPUSD chart.
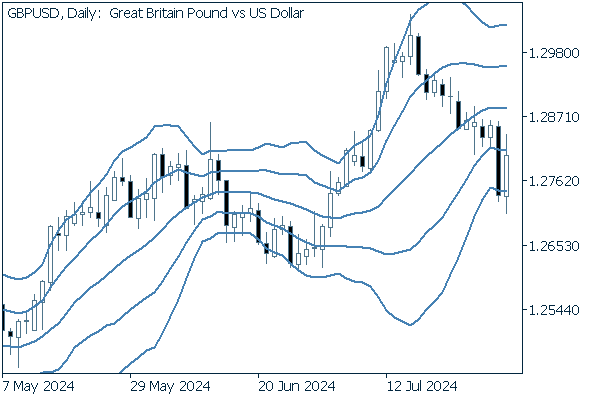
After its upward bandwalk, the pair has begun to adjust downward after breaking below the +1 standard deviation Bollinger Band. This bearish trend sent the pair falling at once to reach the -2 standard deviation Bollinger Band, then marked a long positive candle on Friday.
We continue with an analysis of the GBPUSD weekly chart.
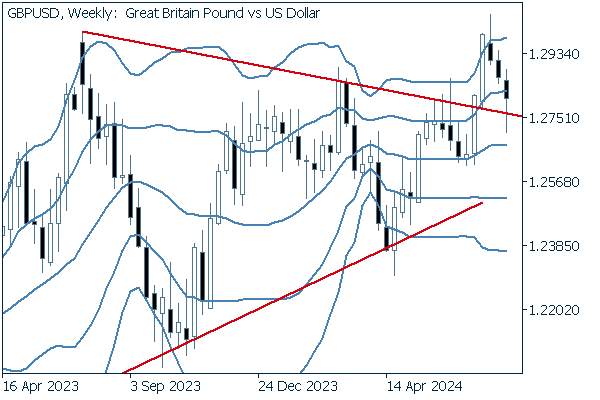
After breaking above the upper edge of the triangle formation and reaching the +2 standard deviation Bollinger Band, the pair first retracted, and then rebounded, but still closed down with a lower whisker around the trendline. It may be a good idea to seek a long position, taking advantage of a falling dollar.
Was this article helpful?
0 out of 0 people found this article helpful.
Thank you for your feedback.
Send