2024.07.29
- Features
-
Services/ProductsServices/ProductsServices/Products

Learn more about the retail trading conditions, platforms, and products available for trading that FXON offers as a currency broker.
You can't start without it.
Trading Platforms Trading Platforms Trading Platforms
Features and functionality comparison of MetaTrader 4/5, and correspondence table of each function by OS
Two account types to choose
Trading Account Types Trading Account Types Trading Account Types
Introducing FXON's Standard and Elite accounts.
close close

-
SupportSupportSupport

Support information for customers, including how to open an account, how to use the trading tools, and a collection of QAs from the help desk.
Recommended for beginner!
Account Opening Account Opening Account Opening
Detailed explanation of everything from how to open a real account to the deposit process.
MetaTrader4/5 User Guide MetaTrader4/5 User Guide MetaTrader4/5 User Guide
The most detailed explanation of how to install and operate MetaTrader anywhere.
FAQ FAQ FAQ
Do you have a question? All the answers are here.
Coming Soon
Glossary Glossary GlossaryGlossary of terms related to trading and investing in general, including FX, virtual currencies and CFDs.
News News News
Company and License Company and License Company and License
Sitemap Sitemap Sitemap
Contact Us Contact Us Contact Us
General, personal information and privacy inquiries.
close close

- Promotion
- Trader's Market
- Partner
-
close close
Learn more about the retail trading conditions, platforms, and products available for trading that FXON offers as a currency broker.
You can't start without it.
Features and functionality comparison of MetaTrader 4/5, and correspondence table of each function by OS
Two account types to choose
Introducing FXON's Standard and Elite accounts.
Support information for customers, including how to open an account, how to use the trading tools, and a collection of QAs from the help desk.
Recommended for beginner!
Detailed explanation of everything from how to open a real account to the deposit process.
The most detailed explanation of how to install and operate MetaTrader anywhere.
Do you have a question? All the answers are here.
Coming Soon
Glossary of terms related to trading and investing in general, including FX, virtual currencies and CFDs.
General, personal information and privacy inquiries.
Useful information for trading and market information is posted here. You can also view trader-to-trader trading performance portfolios.
Find a trading buddy!
Share trading results among traders. Share operational results and trading methods.
- Legal Documents TOP
- Client Agreement
- Risk Disclosure and Warning Notice
- Order and Execution Policy
- Complaints Procedure Policy
- AML/CFT and KYC Policy
- Privacy Policy
- eKYC Usage Policy
- Cookies Policy
- Website Access and Usage Policy
- Introducer Agreement
- Business Partner Agreement
- VPS Service Terms and Condition

This article was :
published
updated
Weekly FX Market Review and Key Points for the Week Ahead
The currency exchange trading week ended July 28 was marked by a clear momentum toward an appreciating yen. This was evidenced by the USDJPY falling below 152, and the yen crosses, such as the EURJPY and GBPJPY, also moving into a state of general decline.
Negative comments by former U.S. President Trump on yen weakness, President Biden's withdrawal from the upcoming presidential election, and comments by Japanese Digital Minister Kono and Liberal Democratic Party Secretary-General Motegi regarding concerns about yen weakness seem to be factors driving this bullish yen market on the near term.
Equity markets have also displayed a clear sea change; in the U.S., semiconductors and other high-tech stocks, which had been driving the market's growth, were sold off, while in Japan, the Nikkei 225 index fell by over 1,300 yen.
Let's review the market movements through the week.
On Monday and Tuesday, July 22 and 23, there were no particularly noteworthy economic releases. On the 22nd, there were no significant trends emerging for the USDJPY, EURUSD, or GBPUSD. However, on the 23rd, the USDJPY drew an enormous negative candle with a drop from above 157 to below 156. The EURUSD and GBPUSD also marked new lows.
On Wednesday, July 24, data was released for U.S. new home sales in February, falling below an expectation of 640,000 at 617,000 (annualized). Month on month, this was negative growth of -0.6%, versus an expected positive growth of 3.4%. However, the USDJPY had already been sharply down when this release occurred, and the pair rebounded off its low of 153.10 at the time of the announcement.
On Thursday, July 25, the USDJPY hit a low of 151.93 during London trading hours. It was on this day that the high-profile U.S. quarterly real gross domestic product (preliminary values) for the April-June period was released.
The year-on-year growth of 2.8% exceeded the expectations of 2.0%, as well as the previous result of 1.4%. This reversed the USDJPY's momentum into a bullish slant, where it temporarily recovered to above 154 during the day.
On Friday, July 26, another much-awaited release came in the form of the U.S. June personal consumption expenditures (PCE). This core deflator, which excludes food and energy (two areas of high price volatility), showed expenditures slightly beating expectations both month-on-month and year-on-year. This further elevated the USDJPY, which rose to a temporary high of 154.73.
Meanwhile, determined EURUSD bulls slowly pushed the pair up into the second half of the week, closing the pair's trading at 1.08555. The GBPUSD, affected by a resurgent dollar, marked a low of 1.28489 late in the week.
Economic Indicators and Statements to Watch this Week
(All times are in GMT)
July 30 (Tue)
09:00, Europe: April-June quarterly regional gross domestic product (flash regional GDP, quarter-on-quarter data)
09:00, Europe: April-June quarterly regional gross domestic product (flash regional GDP, year-on-year data)
July 31 (Wed)
Japan: Bank of Japan Monetary Policy Meeting, post-meeting policy rate announcement
Japan: Bank of Japan Outlook Report
06:30, Japan: Regular press conference by Bank of Japan Governor Kazuo Ueda
09:00, Europe: July Harmonised Index of Consumer Prices (preliminary HICP, year-on-year data)
09:00, Europe: July Harmonised Index of Consumer Prices (preliminary HICP core index, year-on-year data)
12:15, U.S.: July ADP National Employment Report (month-on-month data)
12:30, U.S.: April-June quarterly employment cost index (quarter-on-quarter data)
18:00, U.S.: Federal Reserve Open Market Committee (FOMC) meeting, post-meeting policy rate announcement
August 1 (Thu)
11:00, U.K.: Bank of England (BOE) policy interest rate announcement
11:00, U.K.: Bank of England Monetary Policy Committee (MPC) meeting
14:00, U.S.: July ISM Manufacturing PMI
August 2 (Fri)
12:30, U.S.: July change in nonfarm payrolls (month-on-month data)
12:30, U.S.: July unemployment rate
12:30, U.S.: July average hourly earnings (month-on-month data)
12:30, U.S.: July average hourly earnings (year-on-year data)
The week is packed with a number of important economic events, starting with the EU GDP release, then the Bank of Japan monetary policy meeting, the U.K. interest rate announcement and the U.S. FOMC meeting, and then closing the week with U.S. jobs report. Given that even a single release can send the market into jittery fluctuation, trading on excessive expectations in such an environment is by no means recommended.
This Week's Forecast
The following currency pair charts are analyzed using an overlay of the ±1 and ±2 standard deviation Bollinger Bands, with a period of 20 days.
USDJPY
The U.S. policy rate is likely to remain unchanged at the FOMC meeting in the early morning of August 1, but at the Bank of Japan's monetary policy meeting on July 31, information leaked to the Nikkei suggests a rate hike.
A prior instance like this in 2023 led to dramatic market movements as players traded on the leak, but when the actual policy announcement resulted in no rate change, the market recoiled violently.
If the same were to follow on this occasion and there was no rate hike at the upcoming monetary policy meeting this week, it is possible that the yen's appreciation due to the rate hike news would be reversed, sending the yen lower.
Next is an analysis of the USDJPY daily chart.
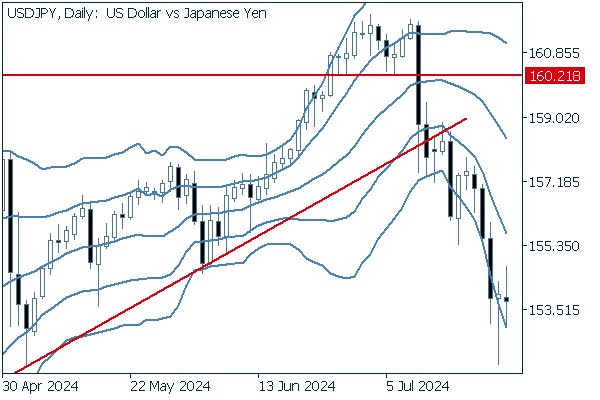

Since falling below the trend line drawn from the low at the end of 2023, the pair has been in a downward bandwalk, falling between the -1 and -2 standard deviation Bollinger Bands. With a larger number of negative to positive candles, we see the chart in a total bear trend.
We continue with an analysis of the USDJPY weekly chart.
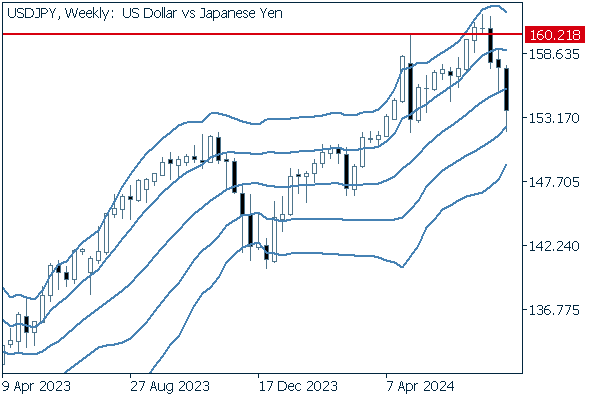

Three consecutive negative candles brought the pair from above the +1 standard deviation Bollinger Band to reach as far as the -1 standard deviation band on an intraweek basis.
Such a bearish pattern commonly leads currency pairs near to the -2 standard deviation band.
EURUSD
This week, the Eurozone's GDP and Harmonised Index of Consumer Prices will be released.
Since the dollar, followed by the yen, are the key market movers this week, it is unlikely the EURUSD will make any particularly explosive moves. Still, this creates a relatively easy trading environment.
Next is an analysis of the EURUSD daily chart.
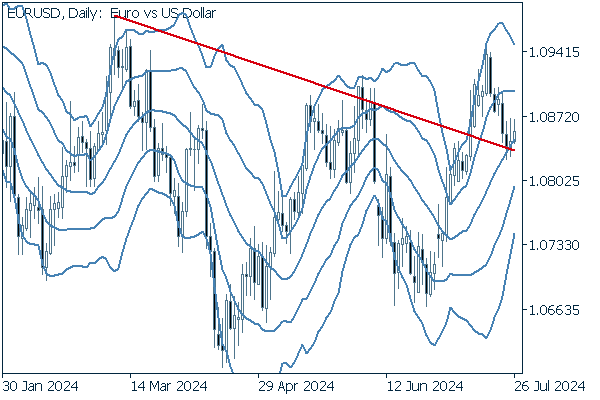

Though the pair had broken above its downtrend line to build reasonable upside, it then retraced to approach the same downtrend line.
With a middle Bollinger Band rising steadily and the pair failing to fall below this line, it is possible that the EURUSD will rise again.
We continue with an analysis of the EURUSD weekly chart.
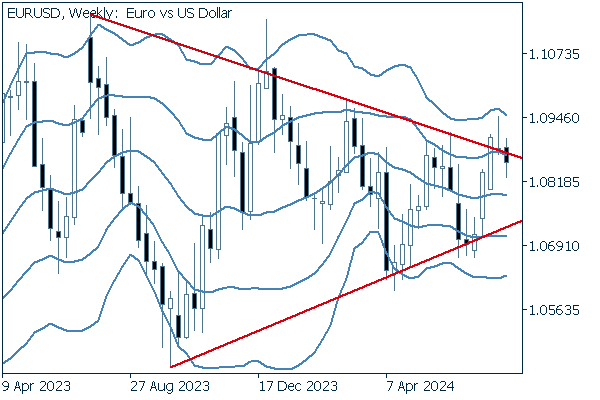

The pair is wavering around the upper edge of its triangle formation. It is unavoidable to assume that the pair will not have the momentum to avoid being pushed back inside the triangle.
GBPUSD
Thursday of this week marks the pound's policy rate announcement, where a 0.25% rate cut is expected.
Now, we analyze the daily GBPUSD chart.
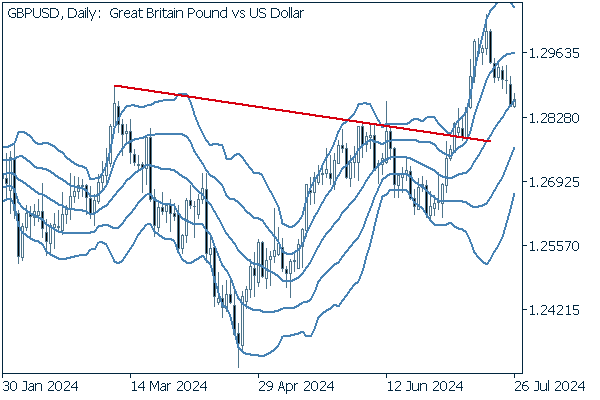

Though the pair had risen well above its trendline, it appears to have entered an adjustment phase after breaking below the +1 standard deviation Bollinger Band. Watch for the adjustment to stop at the middle line or continue to the -1 or -2 standard deviation band.
We continue with an analysis of the GBPUSD weekly chart.
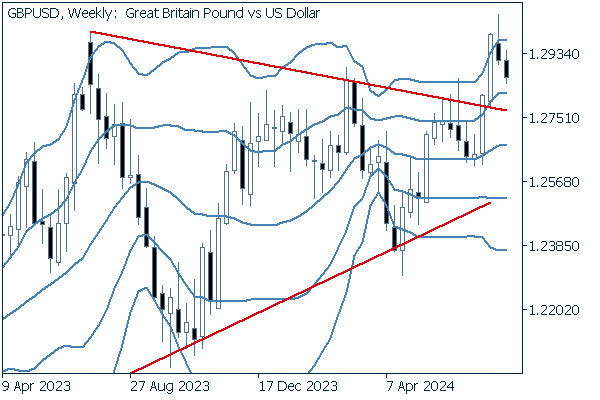

The pair appears to have broken out above its triangle formation, but has yet to start a bull trend. Carefully observe the middle line to see if it angles upward, a sign of an uptrend.
Was this article helpful?
0 out of 0 people found this article helpful.
Thank you for your feedback.
FXON uses cookies to enhance the functionality of the website and your experience on it. This website may also use cookies from third parties (advertisers, log analyzers, etc.) for the purpose of tracking your activities. Cookie Policy
