2024.07.22
This article was :
published
updated
Weekly FX Market Review and Key Points for the Week Ahead
Currency markets in the week ended July 21 were notable in the relative weakness of the dollar, with the USDJPY temporarily falling below 156. Let's review the market movements through the week.
On Tuesday, July 16, the U.S. released its retail data for June, with flat (0.0%) month-on-month growth beating a negative 0.3% forecast. When excluding the automotive sector, retail sales painted a stronger picture, with 0.4% month-on-month beating a 0.0% forecast.
On Wednesday, July 17, the USDJPY fell to around 156 after former U.S. President Donald Trump made comments about the yen's weakness and Japan's Digital Minister Taro Kono reportedly requested that the Bank of Japan raise interest rates to correct the yen's weakness.
On the same day, the Eurozone's Harmonised Index of Consumer Prices (HICP, revised data) was released for June. This was a no-surprise release, with data in line with expectations, including for the core index.
Note that Wednesday was the day that the EURUSD and GBPUSD topped out before beginning a decline through the rest of the week.
In Tokyo morning trading on Thursday, the USDJPY hit a low around 155.50, after which it began a rebound that would be sustained into the end of the week's trading.
Thursday also marked the European Central Bank's (ECB) policy interest rate announcement, holding steady at 4.25% and meeting market expectations. Looking ahead to the next ECB Governing Council meeting in September, there was an open attitude emphasized, with no clear indicators regarding the interest rate.
Economic Indicators and Statements to Watch this Week
(All times are in GMT)
July 24 (Wed)
14:00, U.S.: June new home sales
14:00, U.S.: June new home sales (month-on-month data)
July 25 (Thu)
12:30, United States: April-June quarterly real gross domestic product (preliminary GDP)
July 26 (Fri)
12:30, U.S.: June personal consumption expenditures (PCE deflator)
12:30, U.S.: June personal consumption expenditures (core PCE deflator, excluding food and energy, month-on-month data)
12:30, U.S.: June personal consumption expenditures (core PCE deflator, excluding food and energy)
This week, eyes will be on the U.S. personal consumption expenditures release on Friday the 26th.
This Week's Forecast
The following currency pair charts are analyzed using an overlay of the ±1 and ±2 standard deviation Bollinger Bands, with a period of 20 days.
USDJPY
There has been a clear shift in attitudes toward the USDJPY since mid-July. On July 11, the U.S. Consumer Price Index (CPI) release, combined with the Bank of Japan's currency intervention, sent the pair plummeting from its highs above 160. That weekend, former U.S. President Trump made great strides toward recapturing the presidency after surviving an attempted assassination.
Trump expressed caution that yen weakening had progressed too far, heightening interest in the fall presidential election in the United States with respect to currency developments.
The CME FedWatch tool shows a 95.9% probability that the interest rate will remain unchanged at the July FOMC meeting, showing little room for surprises. From the weekend, Federal Reserve Bank officials will enter a blackout period where they cannot make public statements.
For the September FOMC meeting, the probability of an unchanged rate is 1.9%, showing that we are on a near-certain path to a rate cut.
In addition, the Bank of Japan will hold its monetary policy meeting on July 31. Since the USDJPY fluctuated dramatically during this event last year, caution should be exercised when trading during this period.
Next is an analysis of the USDJPY daily chart.
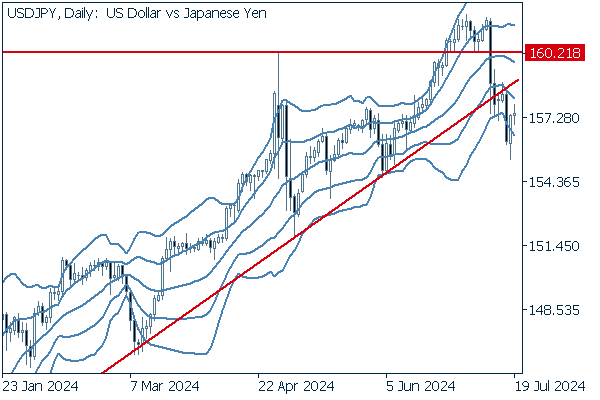
The uptrend line, cleanly drawn from the low at the end of 2023, has been broken by the bearish trend that began two weeks ago. The pair has also touched the -2 standard deviation Bollinger Band, and may have moved into a descending bandwalk between the -1 and -2 standard deviation bands. The middle line has also turned downward.
We can also see that since the day of the CPI release, there have been extremely long negative candles, in contrast to notably short positive candles. This appears to be a textbook downtrend, where upticks are gentle until dramatic falls take over.
We continue with an analysis of the USDJPY weekly chart.
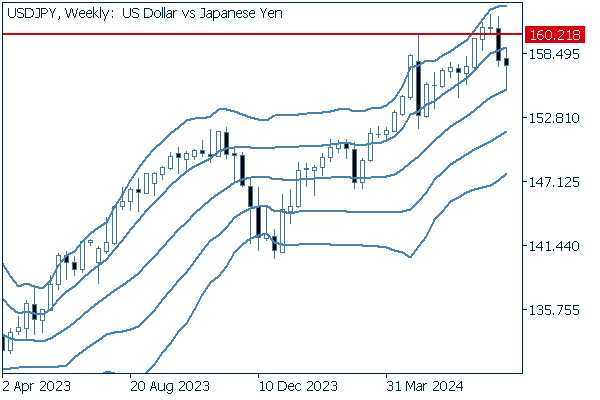
The pair appears to have traced an evening star-like formation, a pattern often found at the beginning of a bearish trend. At the close two trading weeks ago, the price was below the +1 standard deviation Bollinger Band, with the whiskers in the following week of trading reaching the middle line during fluctuating trades.
This is also only the second time in 2024 that there have been two consecutive weekly negative candles. Three consecutive negative weeks would be the first time since the decline that took place in November and December of 2023, indicating a turn in the tides for the currency pair.
EURUSD
As expected, the euro received no interest rate cut in July. As mentioned above, there is currently no clear direction ahead of the September ECB Governing Council meeting.
Lately, dollar bears have demonstrated strong momentum, resulting in a climbing EURUSD.
Next is an analysis of the EURUSD daily chart.
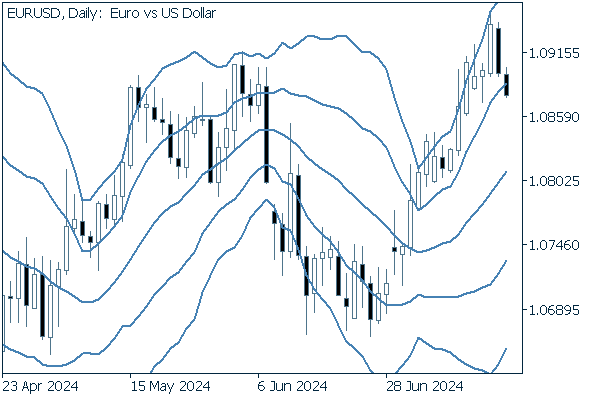
Despite six straight rallies, two days of losses have sent the pair below the +1 standard deviation Bollinger Band. This suggests a potential temporary retrace.
We continue with an analysis of the EURUSD weekly chart.
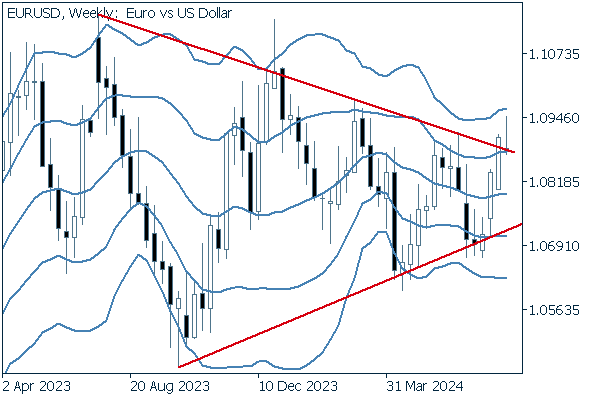
The pair appeared to breach the upper edge of the triangle formation, but returned in the most recent week of trading to leave only upper whiskers above.
GBPUSD
Though pound-watchers have expectations for an August interest rate cut, there is disorganization in direction from conflicting inflation and employment conditions, leading to an unclear outlook.
Now, we analyze the daily GBPUSD chart.
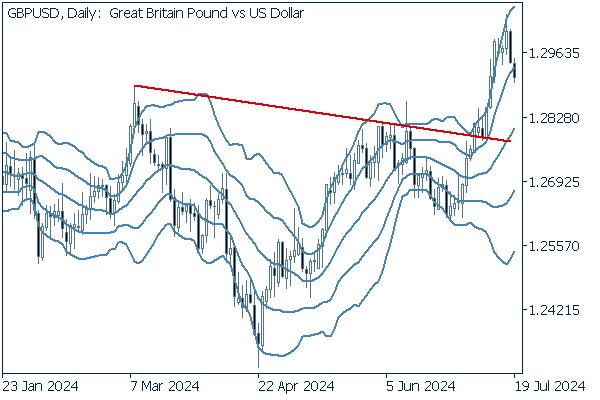
Although the pair has made a clean break above its upper trend line, it has fallen below the +1 standard deviation Bollinger Band, suggesting a phase of further downward adjustment, if temporary. With a middle line on an upward slope, the overall trend still appears to favor the bulls.
We continue with an analysis of the GBPUSD weekly chart.
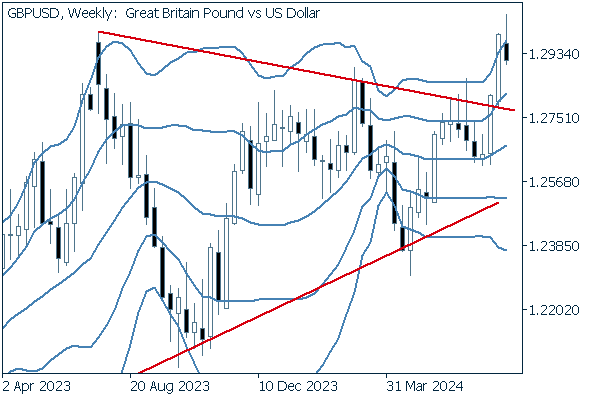
The pair has entered an uptrend, breaking through the upper edge of its triangle formation. A bullish eye on this pair appears justified so long as it remains above the +1 standard deviation Bollinger Band.
Was this article helpful?
0 out of 0 people found this article helpful.
Thank you for your feedback.
Send