2024.07.15
- Features
-
Services/ProductsServices/ProductsServices/Products

Learn more about the retail trading conditions, platforms, and products available for trading that FXON offers as a currency broker.
You can't start without it.
Trading Platforms Trading Platforms Trading Platforms
Features and functionality comparison of MetaTrader 4/5, and correspondence table of each function by OS
Two account types to choose
Trading Account Types Trading Account Types Trading Account Types
Introducing FXON's Standard and Elite accounts.
close close

-
SupportSupportSupport

Support information for customers, including how to open an account, how to use the trading tools, and a collection of QAs from the help desk.
Recommended for beginner!
Account Opening Account Opening Account Opening
Detailed explanation of everything from how to open a real account to the deposit process.
MetaTrader4/5 User Guide MetaTrader4/5 User Guide MetaTrader4/5 User Guide
The most detailed explanation of how to install and operate MetaTrader anywhere.
FAQ FAQ FAQ
Do you have a question? All the answers are here.
Coming Soon
Glossary Glossary GlossaryGlossary of terms related to trading and investing in general, including FX, virtual currencies and CFDs.
News News News
Company and License Company and License Company and License
Sitemap Sitemap Sitemap
Contact Us Contact Us Contact Us
General, personal information and privacy inquiries.
close close

- Promotion
- Trader's Market
- Partner
-
close close
Learn more about the retail trading conditions, platforms, and products available for trading that FXON offers as a currency broker.
You can't start without it.
Features and functionality comparison of MetaTrader 4/5, and correspondence table of each function by OS
Two account types to choose
Introducing FXON's Standard and Elite accounts.
Support information for customers, including how to open an account, how to use the trading tools, and a collection of QAs from the help desk.
Recommended for beginner!
Detailed explanation of everything from how to open a real account to the deposit process.
The most detailed explanation of how to install and operate MetaTrader anywhere.
Do you have a question? All the answers are here.
Coming Soon
Glossary of terms related to trading and investing in general, including FX, virtual currencies and CFDs.
General, personal information and privacy inquiries.
Useful information for trading and market information is posted here. You can also view trader-to-trader trading performance portfolios.
Find a trading buddy!
Share trading results among traders. Share operational results and trading methods.
- Legal Documents TOP
- Client Agreement
- Risk Disclosure and Warning Notice
- Order and Execution Policy
- Complaints Procedure Policy
- AML/CFT and KYC Policy
- Privacy Policy
- eKYC Usage Policy
- Cookies Policy
- Website Access and Usage Policy
- Introducer Agreement
- Business Partner Agreement
- VPS Service Terms and Condition

This article was :
published
updated
Weekly FX Market Review and Key Points for the Week Ahead
In the week ended July 14, the biggest highlight was by far the crashes from Thursday's release of the U.S. Consumer Price Index (CPI). The USDJPY, and other yen crosses, went into general collapse. With the weaker dollar, the EURUSD and GBPUSD also marked fresh highs.
From Monday to Wednesday of the most recent trading week, there were no highly impactful economic indicators. On Tuesday and Wednesday, Federal Reserve Chairman Jerome Powell testified before Congress. His testimony did not appear to take on a dovish tone currency-wise, encouraging a round of dollar buying. This drove the USDJPY, EURJPY, and GBPJPY higher.
Then, on Thursday, July 11, came the U.S. CPI release. Data showed negative growth, at -0.1% month on month versus a 0.1% forecast, and 3.0% year-on-year growth versus a 3.1% forecast. In addition, the core index rose 0.1% month on month versus a 0.2% forecast, and was up 3.3% year on year versus a 3.4% forecast.
These overall weaker-than-expected results led to a selloff in the dollar. Furthermore, it appears that the Bank of Japan may have intervened in the foreign exchange market immediately after the CPI release. Masato Kanda, Japan's top currency diplomat, offered no conclusive comment on whether there was an intervention. However, given the difference between the estimated value of the current account change factors for July 16 (as released on July 12) and market estimates, it is estimated that there were purchases of approximately 3.5 trillion yen made.
Again on Thursday, the U.K. released its month-on-month GDP data for May, showing a strong 0.4% growth versus a 0.2% forecast and leading to a round of pound buying.
On Friday, July 12, the U.S. wholesale pricing index (Producer Price Index, or PPI) for June was released, showing overall strong results. Despite this, the USDJPY fell once again after that, breaking below 158. The pair closed the week's trading around this level, at 157.86.
The yen also showed relative strength in late-week trading in other crosses, with the EURJPY and GBPJPY falling below 173 and 206, respectively.
Economic Indicators and Statements to Watch this Week
(All times are in GMT)
July 15 (Mon)
16:30, U.S.: Press conference by Federal Reserve Chairman Jerome Powell
July 16 (Tue)
12:30, U.S.: June retail sales (month-on-month data)
12:30, U.S.: June retail sales (month-on-month data, excluding automobiles)
July 17 (Wed)
09:00, Europe: June Harmonised Index of Consumer Prices (revised HICP, year-on-year data)
09:00, Europe: June Harmonised Index of Consumer Prices (revised HICP core index, year-on-year data)
July 18 (Thu)
12:15, Europe: European Central Bank (ECB) Governing Council policy interest rate announcement
12:45, Europe: Regular press conference by European Central Bank (ECB) President Christine Lagarde
23:30, Japan: June Consumer Price Index, Japan (CPI, all items, year-on-year data)
23:30, Japan: June Consumer Price Index, Japan (CPI, all items less fresh food, year-on-year data)
In the upcoming trading week, attention will be focused on U.S. retail sales figures on Tuesday, July 16. If this release reveals a weaker-than-expected result, this could lead to further bearish momentum in the dollar.
This Week's Forecast
The following currency pair charts are analyzed using an overlay of the ±1 and ±2 standard deviation Bollinger Bands, with a period of 20 days.
USDJPY
According to the CME's FedWatch tool, the first dollar rate cut is likely to occur at the September FOMC meeting, when the probability of an unchanged rate is 3.8%. As it stands, an interest rate cut is nearly a foregone conclusion.
Assuming this trajectory of maintained, a majority of respondents expect a rate cut at the November FOMC meeting. There will be another FOMC meeting in December, and it appears likely that the FOMC will cut interest rates at about two of its three meetings from September to the end of the year.
Next is an analysis of the USDJPY daily chart.
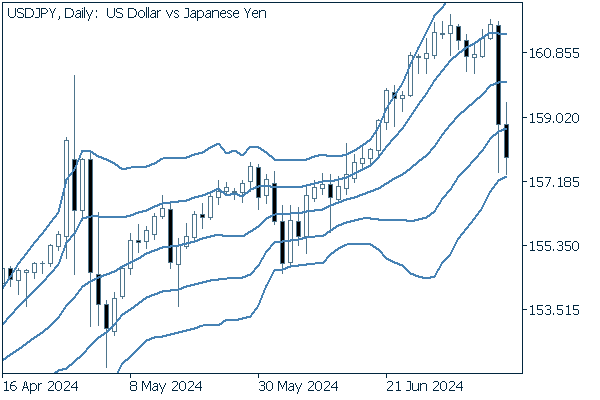

Though the pair broke below the +1 standard deviation Bollinger Band, the price returned to trade in a range above the band after a jump in the first half of the week. However, Thursday's CPI release caused a big drop, and the pair continued to fall on Friday, penetrating the Bollinger Bands to reach the -2 standard deviation band.
We continue with an analysis of the USDJPY weekly chart.
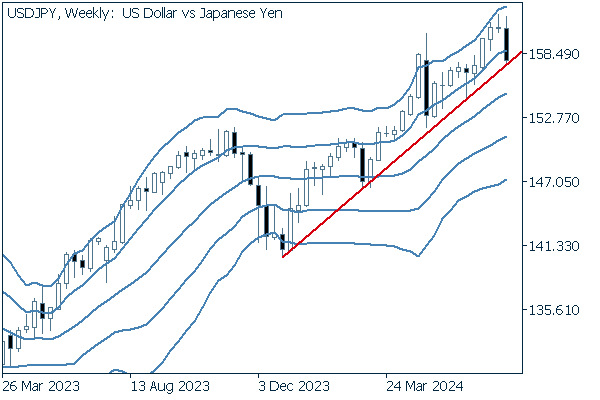

In the most recent trading week, the sharp drop touched the uptrend line before a slight rebound to close trading. A break below this line at the weekly level could lead to a full-fledged trend reversal.
EURUSD
The accelerating depreciation of the dollar has given the EURUSD chart the distinct impression of a bullish trend. On Wednesday, July 17, watch for the release of the Eurozone's Harmonised Index of Consumer Prices.
Next is an analysis of the EURUSD daily chart.
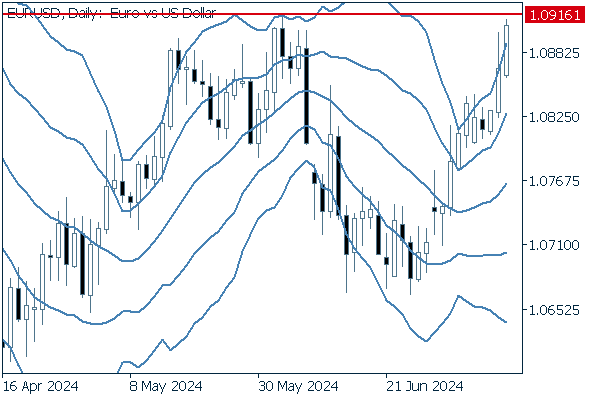

The pair is closing in on the most recent high of 1.09161.
The presence of only two negative candlesticks so far in the month of July also suggests upward momentum from this point.
The pair has already entered an upward bandwalk, and a break to higher highs may only be a matter of time.
We continue with an analysis of the EURUSD weekly chart.
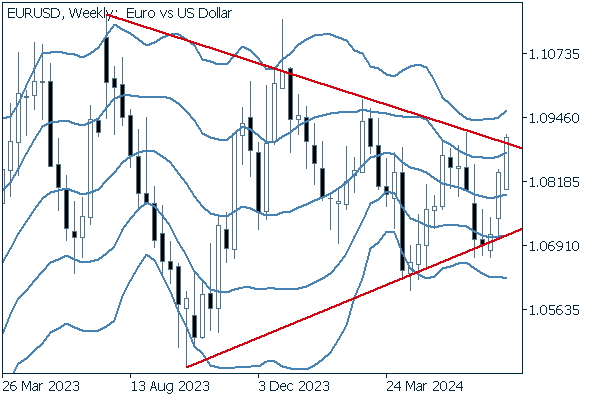

The pair has touched the upper edge of its triangle formation, and depending on interpretation, has broken above slightly at the weekly close. If the trend continues and a clear upward break is confirmed, this could pave the way for a long-term uptrend.
GBPUSD
The strong pound, like its euro cousin, drove up the GBPUSD as it rose against the dollar. This strength also carried over against the yen, with the GBPJPY holding at a high level.
Now, we analyze the daily GBPUSD chart.
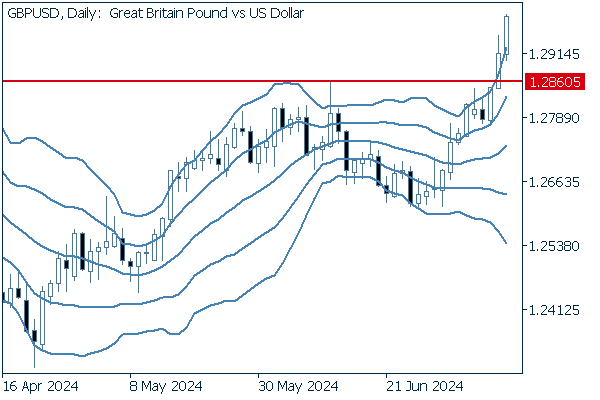

The pair has handily broken above the recent high of 1.28605, launching an upward bandwalk. With the exception of last Tuesday's short negative candlestick, recent trading days have been almost entirely positive at the close.
We continue with an analysis of the GBPUSD weekly chart.
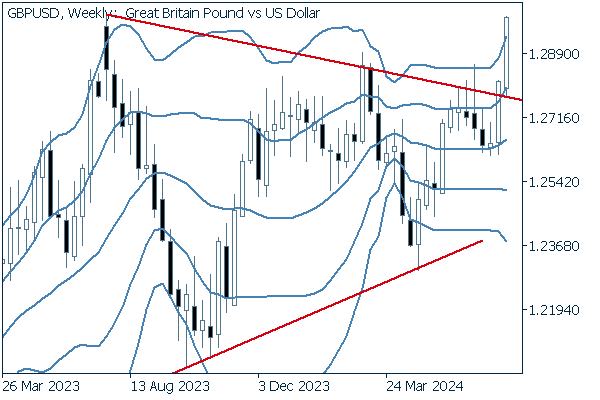

It looks very likely that the pair has broken above the upper edge of its triangle formation, offering the strong potential of a long-term bullish trend ahead.
Was this article helpful?
0 out of 0 people found this article helpful.
Thank you for your feedback.
FXON uses cookies to enhance the functionality of the website and your experience on it. This website may also use cookies from third parties (advertisers, log analyzers, etc.) for the purpose of tracking your activities. Cookie Policy
