2024.07.08
- Features
-
Services/ProductsServices/ProductsServices/Products

Learn more about the retail trading conditions, platforms, and products available for trading that FXON offers as a currency broker.
You can't start without it.
Trading Platforms Trading Platforms Trading Platforms
Features and functionality comparison of MetaTrader 4/5, and correspondence table of each function by OS
Two account types to choose
Trading Account Types Trading Account Types Trading Account Types
Introducing FXON's Standard and Elite accounts.
close close

-
SupportSupportSupport

Support information for customers, including how to open an account, how to use the trading tools, and a collection of QAs from the help desk.
Recommended for beginner!
Account Opening Account Opening Account Opening
Detailed explanation of everything from how to open a real account to the deposit process.
MetaTrader4/5 User Guide MetaTrader4/5 User Guide MetaTrader4/5 User Guide
The most detailed explanation of how to install and operate MetaTrader anywhere.
FAQ FAQ FAQ
Do you have a question? All the answers are here.
Coming Soon
Glossary Glossary GlossaryGlossary of terms related to trading and investing in general, including FX, virtual currencies and CFDs.
News News News
Company and License Company and License Company and License
Sitemap Sitemap Sitemap
Contact Us Contact Us Contact Us
General, personal information and privacy inquiries.
close close

- Promotion
- Trader's Market
- Partner
-
close close
Learn more about the retail trading conditions, platforms, and products available for trading that FXON offers as a currency broker.
You can't start without it.
Features and functionality comparison of MetaTrader 4/5, and correspondence table of each function by OS
Two account types to choose
Introducing FXON's Standard and Elite accounts.
Support information for customers, including how to open an account, how to use the trading tools, and a collection of QAs from the help desk.
Recommended for beginner!
Detailed explanation of everything from how to open a real account to the deposit process.
The most detailed explanation of how to install and operate MetaTrader anywhere.
Do you have a question? All the answers are here.
Coming Soon
Glossary of terms related to trading and investing in general, including FX, virtual currencies and CFDs.
General, personal information and privacy inquiries.
Useful information for trading and market information is posted here. You can also view trader-to-trader trading performance portfolios.
Find a trading buddy!
Share trading results among traders. Share operational results and trading methods.
- Legal Documents TOP
- Client Agreement
- Risk Disclosure and Warning Notice
- Order and Execution Policy
- Complaints Procedure Policy
- AML/CFT and KYC Policy
- Privacy Policy
- eKYC Usage Policy
- Cookies Policy
- Website Access and Usage Policy
- Introducer Agreement
- Business Partner Agreement
- VPS Service Terms and Condition

This article was :
published
updated
Weekly FX Market Review and Key Points for the Week Ahead
During the week ended July 7, currency trades were marked by fresh highs: the USDJPY hit a 37-year high of 161.95 mid-week, while the EURUSD and GBPUSD also reached highs at about the same time. However, the USDJPY would then fall from that high, with the EURUSD and GBPUSD entering a nearly unbroken bullish streak to finish the week.
The uptrend in the EURUSD and GBPUSD was spurred by a tempered dollar due to weak economic indicators, while political tensions calmed in the U.K. and France.
Let's review the market movements through the week.
On Monday, July 1, the U.S. released its June ISM Manufacturing PMI, with a result of 48.5 falling below the forecast of 49.2. Following the PMI's release, the USDJPY briefly fell below 161, but quickly reversed to restore its bullish trend.
On Tuesday, June 2, the Eurozone's June Harmonised Index of Consumer Prices (preliminary values) was released. The year-on-year change in the core index indicated a slightly inflationary bearing, with a result of 2.9% versus a forecast of 2.8%.
On Wednesday, July 3, the U.S. released its June ADP National Employment Report, showing 150,000 jobs added, a weaker result than the expected 160,000.
Also released on Wednesday was the U.S. June ISM Non-Manufacturing PMI (composite), with the reading of 48.8 falling well below the expectation of 52.5. This triggered a sharp downturn in the USDJPY, marking a turning point for the week.
On Friday, April 5, the highly anticipated U.S. jobs report for June was released. With the exception of a slight increase in the unemployment rate, the results were largely in line with expectations, but did not have enough impact to change the overall market trend.
Economic Indicators and Statements to Watch this Week
(All times are in GMT)
July 9 (Tue)
14:00, U.S.: Conference by Federal Reserve Chairman Jerome Powell
July 10 (Wed)
14:00, U.S.: Conference by Federal Reserve Chairman Jerome Powell
July 11 (Thu)
06:00, U.K.: May monthly gross domestic product (GDP, month-on-month data)
12:30, U.S.: June Consumer Price Index (CPI, month-on-month data)
12:30, U.S.: June Consumer Price Index (CPI, year-on-year data)
12:30, U.S.: June Consumer Price Index (CPI core index, month-on-month data)
12:30, U.S.: June Consumer Price Index (CPI core index, year-on-year data)
The highlight of the coming week will be the Thursday CPI release. The USDJPY, which had risen to just below 162, has been pushed back to below 161. Now, weak dollar-related economic indicators are reviving speculation of two rate cuts before the end of 2024.
A CPI release supporting this conclusion could easily spur the pair to fall below 160.
This Week's Forecast
The following currency pair charts are analyzed using an overlay of the ±1 and ±2 standard deviation Bollinger Bands, with a period of 20 days.
USDJPY
The CME FedWatch tool has fallen to a 22.1% probability of the FOMC keeping rates unchanged at its September meeting. A week ago, that probability was 35.9%, indicating that the direct economic indicator results suggest that inflation is receding, and that the expectation of a rate cut is increasing.
Next is an analysis of the USDJPY daily chart.
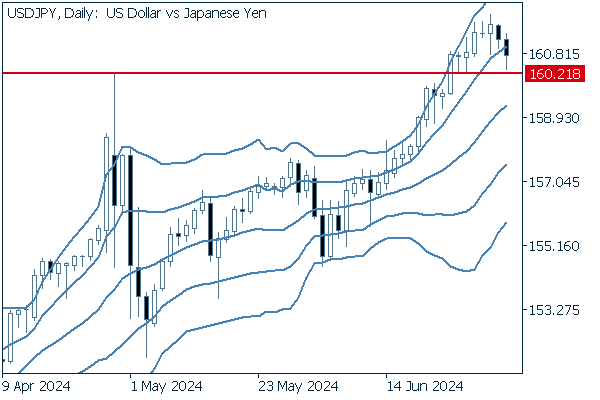

Though there was a longstanding upward bandwalk within the bounds of the +1 and +2 standard deviation Bollinger Bands, Friday's candle broke below the +1 standard deviation band.
This decline, however, was reversed by a resistance turned nearly entirely to a support at 160.21, and the pair closed the week's trading just below 161, though still under the +1 standard deviation band. If the pair remains unable to climb above the band and downward adjustment continues, it may follow the likely pattern of falling to the -1 standard deviation Bollinger Band. Any traders considering long positions in this pair should carefully judge the timing before doing so.
We continue with an analysis of the USDJPY weekly chart.
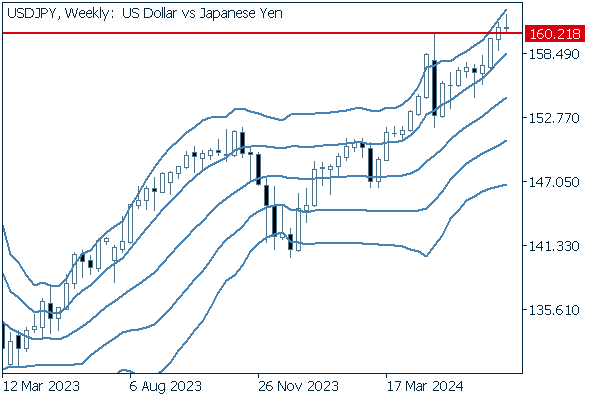

Though this week's trades closed with nearly zero net movement, leaving a crosshair-like candle, it remains on an upward bandwalk, indicating there is still rising momentum.
The key will be whether this pair can hold its ground above 160.
EURUSD
The stormy political situation in France appears to be abating; the ruling party and a leftist coalition are expected to prevent the far-right from winning control of the National Assembly in the deciding round of voting.
The EURJPY's significant climb is a clear indicator of the euro's strength.
Next is an analysis of the EURUSD daily chart.
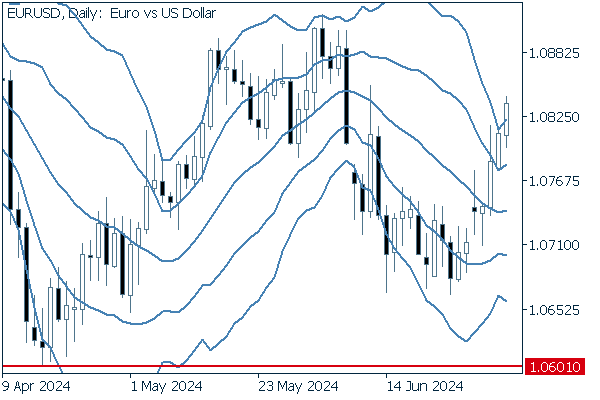

The currency opened the week much higher, and then rallied four consecutive days beginning Tuesday. The week's rally already sent candlesticks shooting above the +2 standard deviation Bollinger Band, demonstrating a strong upward momentum.
We continue with an analysis of the EURUSD weekly chart.
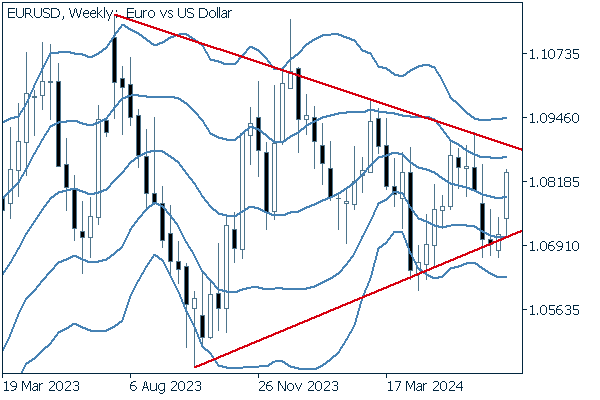

On a weekly basis, the pair has rebounded off the lower edge of its triangle formation and is now on the rise again. Which way the pair breaks from here will be of great interest.
GBPUSD
Bullish pressure is also strong for the pound, shown in its yen cross (GBPJPY) reaching 205 at a climb even more pronounced than that of the USDJPY.
Now, we analyze the daily GBPUSD chart.
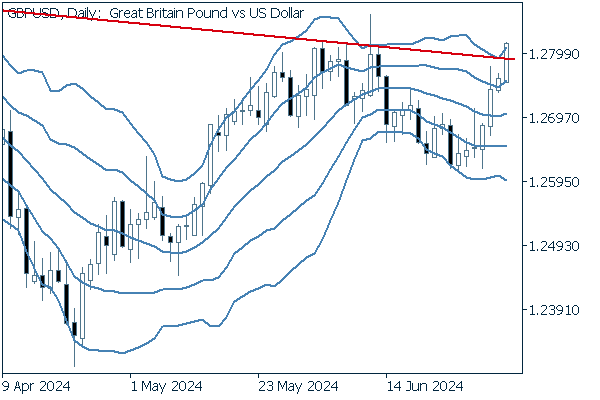

Starting Tuesday, there have been four consecutive positive candles, with Friday's candle closing above the high resistance line. The pattern may continue to move into an upward Bollinger Band walk.
We continue with an analysis of the GBPUSD weekly chart.
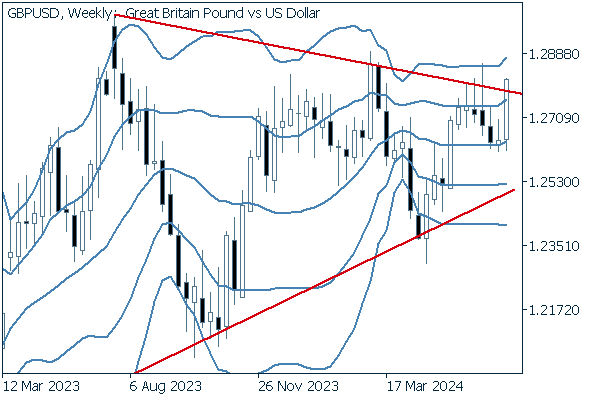

The pair has closed above the upper edge of its triangle formation for the week, the possible opening move of a combined daily/weekly uptrend.
Was this article helpful?
0 out of 0 people found this article helpful.
Thank you for your feedback.
FXON uses cookies to enhance the functionality of the website and your experience on it. This website may also use cookies from third parties (advertisers, log analyzers, etc.) for the purpose of tracking your activities. Cookie Policy
