


2024.07.01
This article was :
published
updated
Weekly FX Market Review and Key Points for the Week Ahead
In the week ended June 30, the USDJPY broke beyond previous highs just above 160 on Wednesday, climbing to above 161. Though the pair retraced in the following two days, it managed to close the week above the former high of 160.21 regardless.
Friday's U.S. personal consumption expenditures (PCE) report delivered data in line with market expectations, answering the significant market attention with no surprises.
As for the yen crosses, the EURJPY and GBPJPY rose to higher highs during the week, despite no significant direction in the EURUSD and GBPUSD. In particular, since the EURJPY reached its highest level since the inception of the euro, this indicates that yen selling was more powerful than dollar buying.
Let's review the market movements through the week.
On Monday and Tuesday, June 24 and 25, there were no particularly influential economic events.
On Wednesday, June 26, as already mentioned, the USDJPY broke above its year-to-date high of 160.21. Later, during New York trading hours, the May new home sales report for the U.S. was released, and both the annualized figures and the month-on-month change were lower than expected. However, this release did not significantly slow the trend toward a stronger dollar and a weaker yen, and the USDJPY continued to rise until the close, reaching a high of 160.86.
On Thursday, June 27, the U.S. government released finalized quarterly GDP for January to March, with quarter-on-quarter growth of 1.4% beating expectations of 1.3%.
The USDJPY would then temporarily retrace to the low 160 area that day, but returned to near Wednesday's highs by the close of the session.
On Friday, June 28, the U.S. PCE results were largely in line with expectations, but the dollar still fell sharply against the yen before and after the announcement. Despite this drop, the pair rebounded just above 160.21, which it had already broken above, showing a resistance turned support. The USDJPY would eventually maintain its position above 160.50 to close the week's trading.
Economic Indicators and Statements to Watch this Week
(All times are in GMT)
July 1 (Mon)
23:50 (Sunday night), Japan: Bank of Japan April-June Short-Term Economic Survey of Enterprises (Tankan)
14:00, U.S.: June ISM Manufacturing PMI
July 2 (Tue)
09:00, Europe: June Harmonised Index of Consumer Prices (preliminary HICP, year-on-year data)
09:00, Europe: June Harmonised Index of Consumer Prices (preliminary HICP core index, year-on-year data)
13:30, U.S.: Conference by Federal Reserve Chairman Jerome Powell
July 3 (Wed)
12:15, U.S.: June ADP National Employment Report (month-on-month data)
14:00, U.S.: June ISM Non-Manufacturing PMI (composite)
18:00, U.S.: Federal Reserve Open Market Committee (FOMC) meeting minutes
July 4 (Thu)
11:30, Europe: European Central Bank (ECB) Governing Council meeting minutes
July 5 (Fri)
12:30, U.S.: June change in nonfarm payrolls (month-on-month data)
12:30, U.S.: June unemployment rate
12:30, U.S.: June average hourly earnings (month-on-month data)
12:30, U.S.: June average hourly earnings (year-on-year data)
The coming week is the first of the month, meaning that there will be a number of high-profile events, including employment data out of the United States on Friday.
This Week's Forecast
The following currency pair charts are analyzed using an overlay of the ±1 and ±2 standard deviation Bollinger Bands, with a period of 20 days.
USDJPY
Though the U.S. employment data will come out late in the week, and such a major economic indicator would usually prompt a wait-and-see attitude in the market, trends of late have been to throw caution to the wind, sending markets into violent fluctuation; this week may well be another example of this.
With the USDJPY exceeding 160, the number of statements by Bank of Japan officials has also increased, suggesting that we are now in a phase where traders are looking to see how much upside they can capture while watching out for intervention.
Next is an analysis of the USDJPY daily chart.
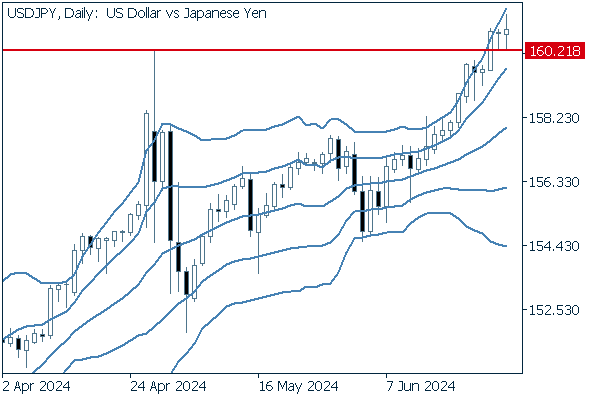
The pair has broken above its former high marked during Japan's Golden Week holidays around two months ago, and has stayed above this new support. Looking at the Bollinger Bands, the pair has also begun an upward bandwalk. The widening bandwidth shows intensifying volatility, and the chart suggests an aim toward a further upside.
We continue with an analysis of the USDJPY weekly chart.
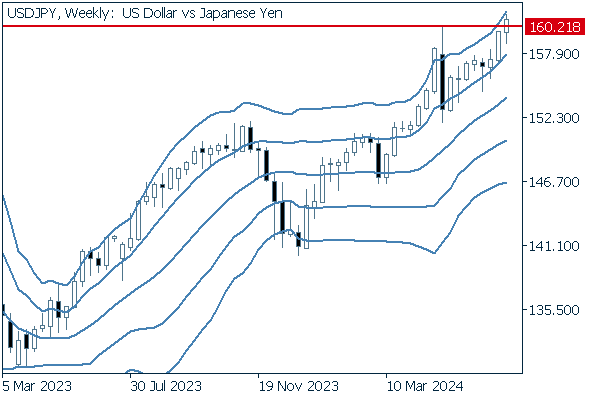
Of course, we can see that the pair has closed above highs on a weekly basis as well.
Not only that, but the pair has generally maintained an upward bandwalk since the beginning of this year, which can be deemed a sign of a long-term buying trend.
EURUSD
This week, the Eurozone's June Harmonised Index of Consumer Prices will be released on Tuesday, July 2. Market expectations are for a slight pullback in inflation.
It will also be interesting to see how the results of the French National Assembly election, the first round of which was held on Sunday, June 30, will affect exchange rates.
Next is an analysis of the EURUSD daily chart.
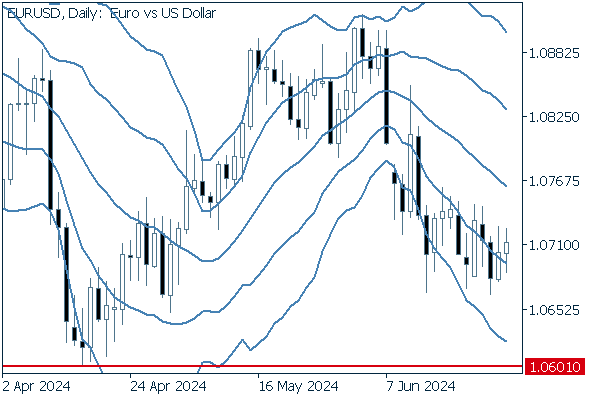
The pair has ended its downward bandwalk, oscillating above the -1 standard deviation Bollinger Band.
We continue with an analysis of the EURUSD weekly chart.
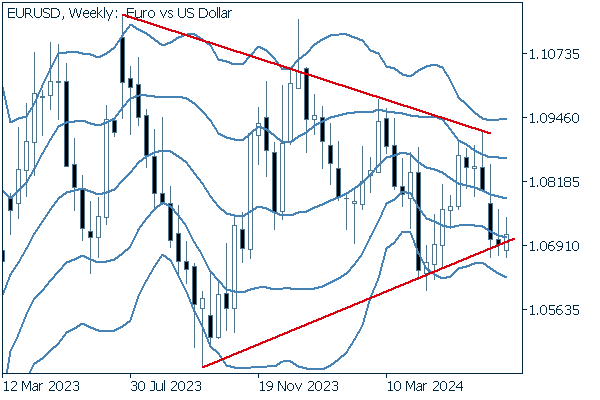
The pair appeared to momentarily break below the lower edge of its triangle formation, but was pushed back inside.
GBPUSD
This week holds no strong indicators or key statements related to the pound. Therefore, trades will focus on dollar and even euro movements.
Now, we analyze the daily GBPUSD chart.
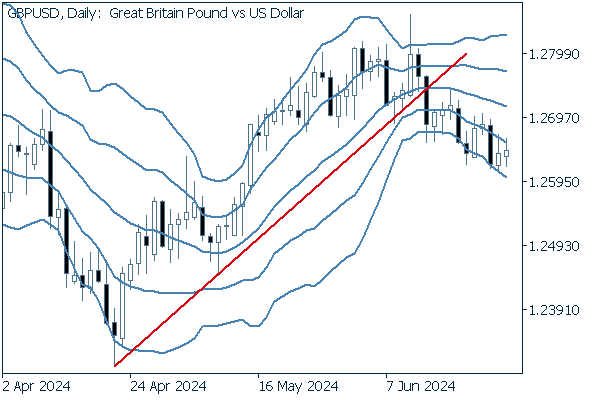
After falling below its uptrend line, the pair has transitioned into a gently bearish trend.
We can see that this is not an especially potent downtrend given that the pair has crossed above the -1 standard deviation Bollinger Band many times.
We continue with an analysis of the GBPUSD weekly chart.
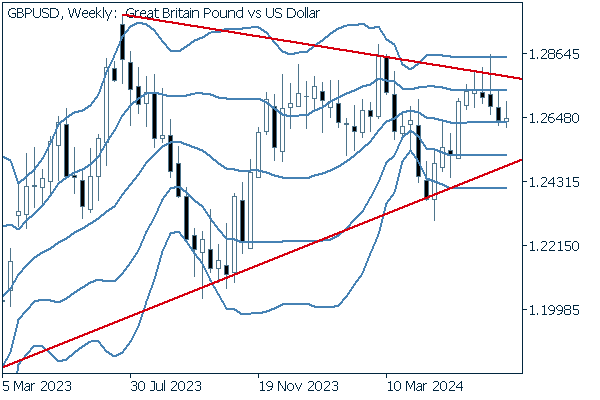
The pair remains within a tightening triangle formation, begging the question of which way it will break.
Was this article helpful?
0 out of 0 people found this article helpful.
Thank you for your feedback.
Send