


2024.06.24
This article was :
published
updated
Weekly FX Market Review and Key Points for the Week Ahead
In the week ending Sunday, June 23, the dollar's bulls and the yen's bears further entrenched their positions.
The USDJPY closed up seven straight days, with Thursday's and Friday's gains putting the pair just within reach of 160. It appears that this past week has carried forward the undertone from the previous week of trading, where dollar bulls gained ground from a reduced FOMC member expectation to only one rate cut within 2024, and where yen bears added momentum when a reduction in JGB purchases was postponed at the BOJ's monetary policy meeting.
The EURUSD and GBPUSD also marked fresh weekly lows, driven by French political unrest and buoyancy in the dollar. We can also see the yen in a bearish posture vis-a-vis the euro and pound, given the upward motion in the EURJPY and GBPJPY.
Let's review the market movements through the week.
On Tuesday, June 18, the Eurozone's May Harmonised Index of Consumer Prices (HICP) was released. This release showed that month-on-month and year-on-year movements matching market expectations.
On the same day, U.S. retail sales data were announced. Month on month, growth was 0.1% versus a 0.2% forecast, and when excluding the automotive sector, retail sales were down 0.1% versus a forecast of 0.2% growth. This reshaped currency markets toward short positions on the dollar, temporarily driving the USDJPY down and the EURUSD and GBPUSD up; however, these movements could not be sustained.
On Thursday, June 20, the Bank of England's (BOE) policy interest rate announcement once again met market expectations, holding steady at 5.25%. The vote split was also unchanged from the previous meeting, at seven to two members in favor of unchanged rates. However, the statement that the decision to remain unchanged was "finely balanced" reinforced expectations of a coming rate cut. An August start for interest rate cuts is becoming a more prevalent market view.
On Friday, June 21 (local time), Japan's May Consumer Price Index (CPI) was released, showing results that were overall weaker than expected.
The CME's FedWatch tool shows that the U.S. policy rate has an 89.7% probability of being left unchanged at the July 31 FOMC meeting. Meanwhile, for the September 18 FOMC meeting, the unchanged rate probability drops to 34.1%.
Note that on June 21, the U.S. Treasury Department added Japan to its monitoring list for potential currency manipulation. Though this does not yet constitute designating Japan as a currency manipulator, the department recognized that the exchange rate is working in Japan's favor based on the level of current account surpluses and other factors.
Economic Indicators and Statements to Watch this Week
(All times are in GMT)
June 26 (Wed)
14:00, U.S.: May new home sales (annualized data)
14:00, U.S.: May new home sales (month-on-month data)
June 27 (Thu)
12:30, U.S.: January-March quarterly real gross domestic product (finalized GDP, quarter-on-quarter annualized data)
June 28 (Fri)
06:00, U.K.: January-March quarterly gross domestic product (revised GDP, quarter-on-quarter data)
06:00, U.K.: January-March quarterly gross domestic product (revised GDP, year-on-year data)
12:30, U.S.: May personal consumption expenditures (PCE deflator, year-on-year data)
12:30, U.S.: May personal consumption expenditures (core PCE deflator, excluding food and energy, month-on-month data)
12:30, U.S.: May personal consumption expenditures (core PCE deflator, excluding food and energy, year-on-year data)
Given the extremely high-profile nature of Friday's personal consumption expenditures (PCE) data release, it is possible markets may experience limited volatility until the release.
This Week's Forecast
The following currency pair charts are analyzed using an overlay of the ±1 and ±2 standard deviation Bollinger Bands, with a period of 20 days.
USDJPY
Despite breaking above 160 during Japan's Golden Week holidays, two currency interventions by the Bank of Japan sent the USDJPY back to the mid-150s. From there, the pair made several pushes toward the upside, recovering nearly to its pre-Golden Week offensive level by the end of the most recent week of trading.
It is very likely that the U.S. adding Japan to its currency manipulation monitoring list has impeded the Bank of Japan's foreign exchange market interventions. Therefore, it is not unreasonable to conclude that there will be no intervention until the year-to-date high of 160.21 is broken.
Next is an analysis of the USDJPY daily chart.
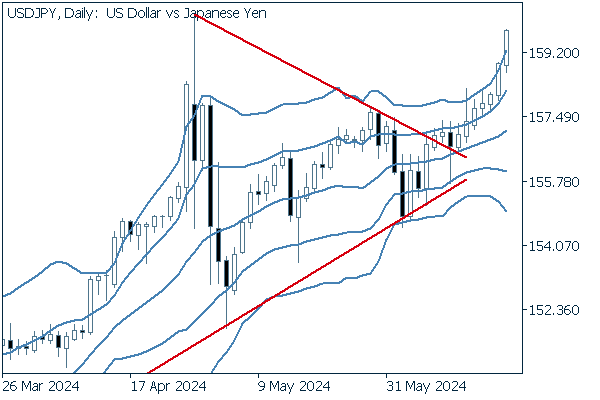
All seven daily candles were positive in the most recent trading week. The pair has broken above the upper edge of its triangle formation and is moving into an upward bandwalk between the +1 and +2 standard deviation Bollinger Bands. A bullish mentality appears well-justified until the pair closes below the +1 standard deviation band.
Naturally, traders must remain vigilant against any potential currency intervention, including via conservative stop-losses and other measures.
We continue with an analysis of the USDJPY weekly chart.
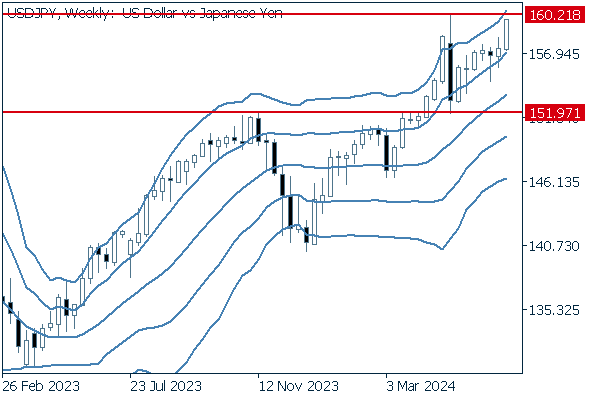
The latest week of trading shows a great deal of upswing at the close. It is also important to note the pair's price position, nearly upon the year-to-date high of 160.21.
EURUSD
Since the euro has already had its first rate cut, it appears unproblematic to take a bearish stance on the pair, with the dollar very likely to have a rate cut in September. This was the directionality seen in the most recent week of price movements.
Next is an analysis of the EURUSD daily chart.
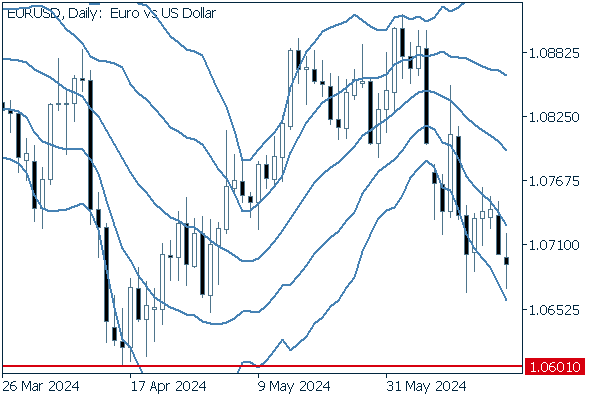
Not only is the middle Bollinger Band falling downward, but the pair is continuing a bandwalk between the -1 and -2 standard deviation bands. A break below the recent low at 1.06010 could accelerate the decline further.
We continue with an analysis of the EURUSD weekly chart.
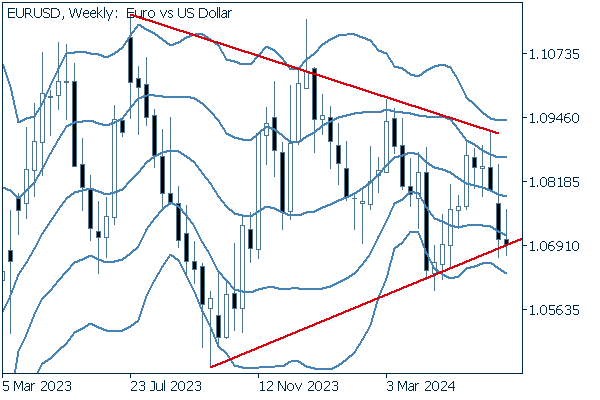
The pair is poised to break below its current triangle formation. Since the daily trend is already showing downward momentum, if the weekly trend were to mimic this, we could see a powerful and sustained multi-timeframe trend for this pair.
GBPUSD
As already mentioned, although there was no rate cut for the pound this month, offramps from monetary tightening have begun to appear on the horizon, and markets are increasingly focusing on an August rate cut scenario.
Now, we analyze the daily GBPUSD chart.
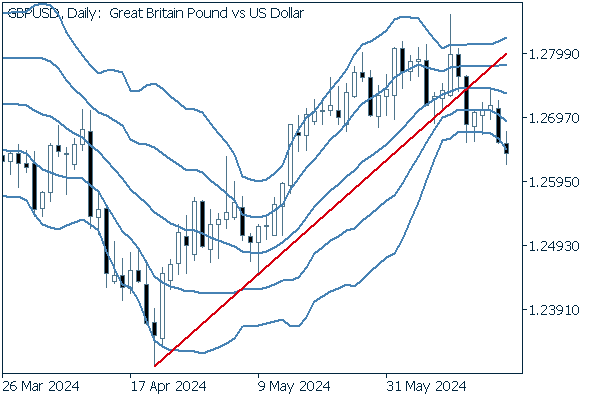
The uptrend trendline was broken last Friday and the chart appears to be forming a new downward bandwalk.
We continue with an analysis of the GBPUSD weekly chart.
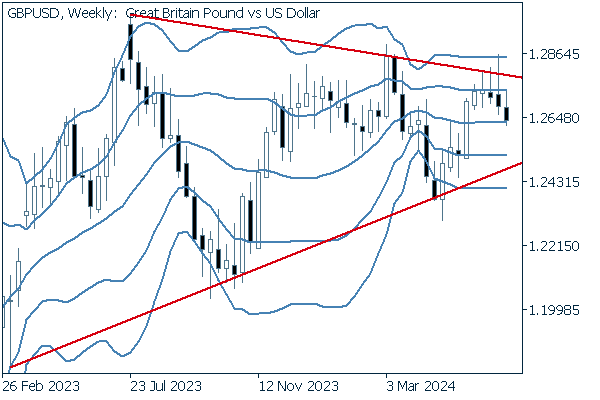
The pair failed to exit the upper edge of the triangle formation, being forced back inside.
With three consecutive negative candles on a weekly basis, bearish pressure is expected to grow.
Was this article helpful?
0 out of 0 people found this article helpful.
Thank you for your feedback.
Send