2024.05.20
- Features
-
Services/ProductsServices/ProductsServices/Products

Learn more about the retail trading conditions, platforms, and products available for trading that FXON offers as a currency broker.
You can't start without it.
Trading Platforms Trading Platforms Trading Platforms
Features and functionality comparison of MetaTrader 4/5, and correspondence table of each function by OS
Two account types to choose
Trading Account Types Trading Account Types Trading Account Types
Introducing FXON's Standard and Elite accounts.
close close

-
SupportSupportSupport

Support information for customers, including how to open an account, how to use the trading tools, and a collection of QAs from the help desk.
Recommended for beginner!
Account Opening Account Opening Account Opening
Detailed explanation of everything from how to open a real account to the deposit process.
MetaTrader4/5 User Guide MetaTrader4/5 User Guide MetaTrader4/5 User Guide
The most detailed explanation of how to install and operate MetaTrader anywhere.
FAQ FAQ FAQ
Do you have a question? All the answers are here.
Coming Soon
Glossary Glossary GlossaryGlossary of terms related to trading and investing in general, including FX, virtual currencies and CFDs.
News News News
Company and License Company and License Company and License
Sitemap Sitemap Sitemap
Contact Us Contact Us Contact Us
General, personal information and privacy inquiries.
close close

- Promotion
- Trader's Market
- Partner
-
close close
Learn more about the retail trading conditions, platforms, and products available for trading that FXON offers as a currency broker.
You can't start without it.
Features and functionality comparison of MetaTrader 4/5, and correspondence table of each function by OS
Two account types to choose
Introducing FXON's Standard and Elite accounts.
Support information for customers, including how to open an account, how to use the trading tools, and a collection of QAs from the help desk.
Recommended for beginner!
Detailed explanation of everything from how to open a real account to the deposit process.
The most detailed explanation of how to install and operate MetaTrader anywhere.
Do you have a question? All the answers are here.
Coming Soon
Glossary of terms related to trading and investing in general, including FX, virtual currencies and CFDs.
General, personal information and privacy inquiries.
Useful information for trading and market information is posted here. You can also view trader-to-trader trading performance portfolios.
Find a trading buddy!
Share trading results among traders. Share operational results and trading methods.
- Legal Documents TOP
- Client Agreement
- Risk Disclosure and Warning Notice
- Order and Execution Policy
- Complaints Procedure Policy
- AML/CFT and KYC Policy
- Privacy Policy
- eKYC Usage Policy
- Cookies Policy
- Website Access and Usage Policy
- Introducer Agreement
- Business Partner Agreement
- VPS Service Terms and Condition

This article was :
published
updated
Weekly FX Market Review and Key Points for the Week Ahead
Currency markets in the past week were sharp and well-defined in their movements.
Influenced by data releases such as the U.S. wholesale pricing index (PPI) and Consumer Price Index (CPI), the USDJPY fell from above 156 to below 154 in the span from May 15 to May 16, but has since rebounded.
Meanwhile, the EURUSD and GBPUSD trended higher as the dollar weakened throughout the week.
On Tuesday, May 14, the U.S. released its wholesale pricing index (Producer Price Index, or PPI), including the core index (which excludes food and energy). Figures were largely unchanged from the same month a year earlier, in line with expectations. The fact that the results did not deviate from the forecast suggests a slowdown in inflation.
On Wednesday, May 15, the intensely watched U.S. Consumer Price Index (CPI) data were also released. Both month-over-month and year-on-year results were largely unchanged as expected, following the PPI and implying a slowdown in inflation.
U.S. retail sales data were also released at the same time, showing flat month-on-month growth versus an expected 0.4%. When excluding the automotive sector, this month-on-month growth was 0.2%, matching a 0.2% forecast.
The results of these economic indicators led to increased speculation of a rate cut at the September FOMC meeting, spurring dollar sell-offs. The USDJPY maintained its downward momentum during the day, hitting its lowest point of 153.59 around midnight GMT leading into Thursday, May 16.
May 15 also saw the release of Europe's January-March quarterly regional gross domestic product (revised regional GDP), meeting expectations of no changes both year-on-year and quarter-on-quarter.
On Thursday, May 16, Japan released its quarterly gross domestic product (preliminary values) for January to March, with figures falling below expectations on both year-on-year and annualized bases. This release reconfirmed that the Japanese economy is in negative growth and may have driven a depreciating yen versus the dollar into the weekend.
On Friday, May 17, revised data for the Eurozone's April Harmonised Index of Consumer Prices (HICP) were released. The results were in line with expectations, including the core index.
Economic Indicators and Statements to Watch this Week
(All times are in GMT)
May 22 (Wed)
18:00, U.S.: Federal Reserve Open Market Committee (FOMC) meeting minutes
May 23 (Thu)
14:00, U.S.: April new home sales (annualized data)
14:00, U.S.: April new home sales (month-on-month data)
23:30, Japan: April Consumer Price Index, Japan (CPI, all items, year-on-year data)
23:30, Japan: April Consumer Price Index, Japan (CPI, all items less fresh food, year-on-year data)
23:30, Japan: April Consumer Price Index, Japan (CPI, all items less fresh food and energy, year-on-year data)
This Week's Forecast
The following currency pair charts are analyzed using an overlay of the ±1 and ±2 standard deviation Bollinger Bands, with a period of 20 days.
USDJPY
This week's headline release will be the minutes from the May U.S. FOMC meeting, which will be released in the evening on Wednesday (18:00 GMT). This public release of discourse at the FOMC will offer interesting new information driving predictions for upcoming monetary policy.
Next is an analysis of the USDJPY daily chart.
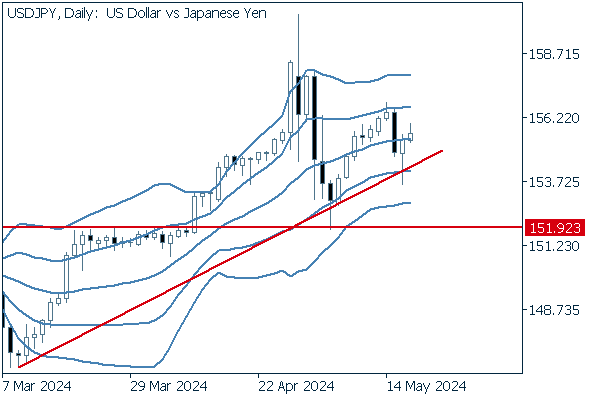

After breaking above the 151.92 resistance, the price continued a bullish charge even above 160 before quickly retreating back below this line. However, this decline was halted once again at the resistance-turned-support of 151.92, and the pair began to rise once again. The diagonal trend line drawn from the pair's movements suggests another potential test of the 160 line.
However, the closer the pair approaches 160, the greater the potential of a BOJ currency intervention; caution is advised.
We continue with an analysis of the USDJPY weekly chart.
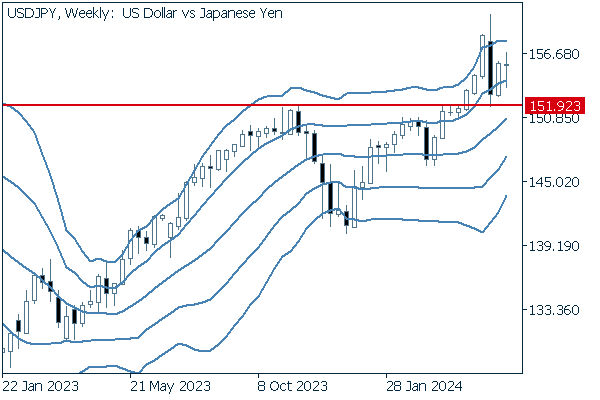

The chart suggests that, as long as the pair stays above 151.92, a bullish sentiment is merited. Last week, the pair temporarily fell below the +1 standard deviation Bollinger Band, but rebounded to leave only a lower whisker.
EURUSD
Last week, the EURUSD rose from 1.0768 to 1.0869 in a price move following the trend of a weaker dollar and a stronger euro.
Next is an analysis of the EURUSD daily chart.
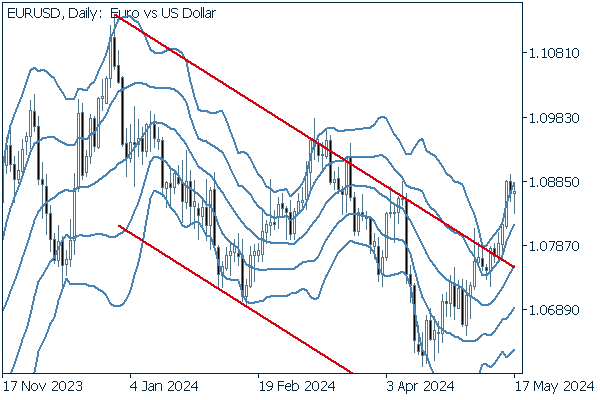

The price has broken through the upper resistance and is now in a bandwalk between the +1 and +2 standard deviation Bollinger Bands. Traders will be watching to see if the pair will test the key resistance at 1.1.
We continue with an analysis of the EURUSD weekly chart.
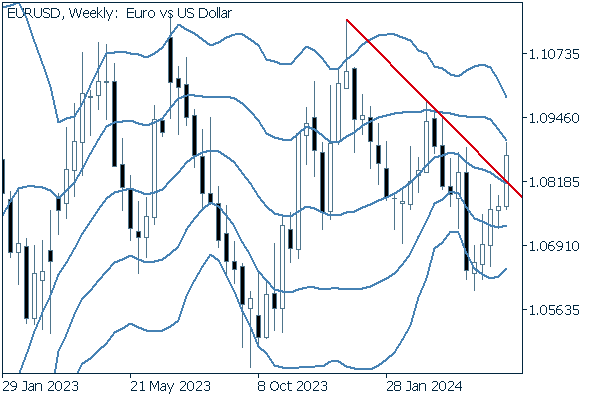

Week to week, the chart confirms a clean break above the upper resistance line. Though the pair has long been trendless in this timeline, it is not inconceivable that this could be the first move of a breakout from its range trading.
GBPUSD
There are no important economic releases involving the pound this week. Even since 2023, the pair's chart has largely resembled that of its EURUSD sibling, with prices mainly influenced by dollar movements. You may consider these two pairs as moving mostly in tandem.
Now, we analyze the daily GBPUSD chart.
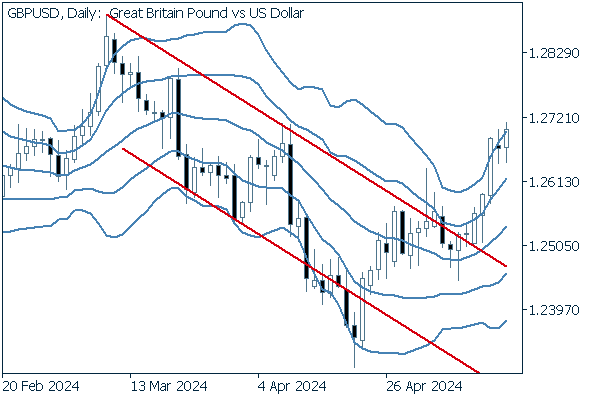

As with the EURUSD, an upward Bollinger Band bandwalk has begun after a break above the upper resistance. Bullish sentiment is justified until the pair closes below the +1 Bollinger Band.
We continue with an analysis of the GBPUSD weekly chart.
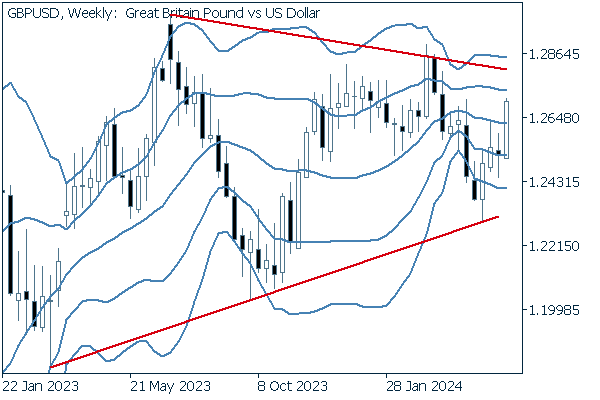

If we zoom out reasonably far, we can see the pair is in a triangle formation, with lows rising and highs falling. The timing of a break in either direction will be important.
Was this article helpful?
0 out of 0 people found this article helpful.
Thank you for your feedback.
FXON uses cookies to enhance the functionality of the website and your experience on it. This website may also use cookies from third parties (advertisers, log analyzers, etc.) for the purpose of tracking your activities. Cookie Policy
