2024.05.13
- Features
-
Services/ProductsServices/ProductsServices/Products

Learn more about the retail trading conditions, platforms, and products available for trading that FXON offers as a currency broker.
You can't start without it.
Trading Platforms Trading Platforms Trading Platforms
Features and functionality comparison of MetaTrader 4/5, and correspondence table of each function by OS
Two account types to choose
Trading Account Types Trading Account Types Trading Account Types
Introducing FXON's Standard and Elite accounts.
close close

-
SupportSupportSupport

Support information for customers, including how to open an account, how to use the trading tools, and a collection of QAs from the help desk.
Recommended for beginner!
Account Opening Account Opening Account Opening
Detailed explanation of everything from how to open a real account to the deposit process.
MetaTrader4/5 User Guide MetaTrader4/5 User Guide MetaTrader4/5 User Guide
The most detailed explanation of how to install and operate MetaTrader anywhere.
FAQ FAQ FAQ
Do you have a question? All the answers are here.
Coming Soon
Glossary Glossary GlossaryGlossary of terms related to trading and investing in general, including FX, virtual currencies and CFDs.
News News News
Company and License Company and License Company and License
Sitemap Sitemap Sitemap
Contact Us Contact Us Contact Us
General, personal information and privacy inquiries.
close close

- Promotion
- Trader's Market
- Partner
-
close close
Learn more about the retail trading conditions, platforms, and products available for trading that FXON offers as a currency broker.
You can't start without it.
Features and functionality comparison of MetaTrader 4/5, and correspondence table of each function by OS
Two account types to choose
Introducing FXON's Standard and Elite accounts.
Support information for customers, including how to open an account, how to use the trading tools, and a collection of QAs from the help desk.
Recommended for beginner!
Detailed explanation of everything from how to open a real account to the deposit process.
The most detailed explanation of how to install and operate MetaTrader anywhere.
Do you have a question? All the answers are here.
Coming Soon
Glossary of terms related to trading and investing in general, including FX, virtual currencies and CFDs.
General, personal information and privacy inquiries.
Useful information for trading and market information is posted here. You can also view trader-to-trader trading performance portfolios.
Find a trading buddy!
Share trading results among traders. Share operational results and trading methods.
- Legal Documents TOP
- Client Agreement
- Risk Disclosure and Warning Notice
- Order and Execution Policy
- Complaints Procedure Policy
- AML/CFT and KYC Policy
- Privacy Policy
- eKYC Usage Policy
- Cookies Policy
- Website Access and Usage Policy
- Introducer Agreement
- Business Partner Agreement
- VPS Service Terms and Condition

This article was :
published
updated
Weekly FX Market Review and Key Points for the Week Ahead
The currency market in the past week has been characterized by a gradually strengthening yen. In the preceding week, ended May 5, the USDJPY fell to approach 151 due to the Bank of Japan's currency intervention and poor U.S. employment data. From there, however, the recovery continued, reaching as high as 155.95, just short of the 156 level.
By contrast, the euro and the pound demonstrated no clear direction vis-a-vis the dollar. Since the EURJPY and GBPJPY showed an uptrend similar to the USDJPY, indicating that the primary movement was from the yen being sold.
The hawkish outlook of many U.S. financial officials also contributed to dollar buying. Conversely, Bank of Japan Governor Kazuo Ueda's comments on interest rate hikes were often inarticulate and laden with assumptions and conditions, contributing to yen sell-offs and setting the tone for the past week.
From Monday, May 6 to Wednesday, May 8, there were no notable economic indicators or statements affecting markets. In addition, since there were no strong indicators for the U.S. or Japanese economies the days following the 8th, the USDJPY continued to rise at a constant tempo throughout the week.
On Thursday, May 9, the Bank of England's (BOE) policy interest rate announcement met expectations, holding steady at 5.25%. The BOE's Monetary Policy Committee (MPC) minutes for Thursday lowered its inflation outlook, with one additional member voting for a rate cut. This has led to a pervading viewpoint that the first interest rate cut may be in June.
On Friday, May 10, the U.K. released its quarterly gross domestic product (preliminary values) for January to March. The quarter-on-quarter increase was 0.6% versus 0.4% expected, and the year-on-year increase was 0.2% versus no change expected.
In addition, the U.K. released its month-on-month GDP data for March, with 0.4% growth versus a 0.1% forecast.
Economic Indicators and Statements to Watch this Week
(All times are in GMT)
May 14 (Tue)
14:00, U.S.: Conference by Federal Reserve Chairman Jerome Powell
May 15 (Wed)
09:00, Europe: January-March quarterly regional gross domestic product (revised regional GDP, quarter-on-quarter data)
09:00, Europe: January-March quarterly regional gross domestic product (revised regional GDP, year-on-year data)
12:30, U.S.: April Consumer Price Index (CPI, month-on-month data)
12:30, U.S.: April Consumer Price Index (CPI, year-on-year data)
12:30, U.S.: April Consumer Price Index (CPI core index, month-on-month data)
12:30, U.S.: April Consumer Price Index (CPI core index, year-on-year data)
12:30, U.S.: April retail sales (month-on-month data)
12:30, U.S.: April retail sales (month-on-month data, excluding automobiles)
23:50, Japan: January-March quarterly real gross domestic product (preliminary GDP, quarter-on-quarter data)
23:50, Japan: January-March quarterly real gross domestic product (preliminary GDP, annualized data)
May 17 (Fri)
09:00, Europe: April Harmonised Index of Consumer Prices (revised HICP, year-on-year data)
09:00, Europe: April Harmonised Index of Consumer Prices (revised HICP core index, year-on-year data)
This week's highlight is a string of CPI releases on Wednesday. Data revealing curtailed inflation could lead to a rate cut, which would drive a dollar sell-off.
The CME FedWatch tool shows a 96.5% probability of the FOMC keeping rates unchanged at its June meeting, showing that the market has determined a rate cut in the immediate term is almost entirely unlikely. Furthermore, the tool shows a 74.6% chance of rates remaining unchanged at the July FOMC meeting. This trend shows a reversal for the September FOMC meeting, where the tool shows, for the first time, a higher probability of a rate cut (48.6% probability of a 0.25% rate cut) than of it remaining unchanged (38.8% probability).
All eyes will be on whether or not the CPI will be able to reverse its trend.
This Week's Forecast
The following currency pair charts are analyzed using an overlay of the ±1 and ±2 standard deviation Bollinger Bands, with a period of 20 days.
USDJPY
To understand this pair's movements better, it might be easier to think of the dynamic as the USDJPY fluctuating each time market forecasts change, such as about when the first USD rate cut will be and how many rate cuts there will be within 2024.
U.S. retail sales, which will be released on Wednesday alongside CPI data, will also be of interest, as there will be no interest rates until the current inflation subsidies.
Next is an analysis of the USDJPY daily chart.
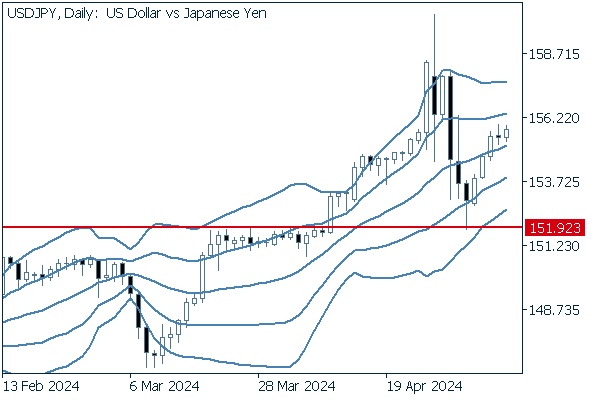

The decline in the pair during the week ended May 5 was halted as the price bounced off the support at 151.92, which had previously served as a resistance many times. Last week, the pair left positive candlesticks four out of five trading days.
The Bollinger Bands' middle line is rising steadily, with candlesticks above the line, indicating a relatively bullish attitude.
However, the closer the pair approaches its latest high of 160, the more likely it is that currency intervention will be triggered, leading to a challenging outlook.
We continue with an analysis of the USDJPY weekly chart.
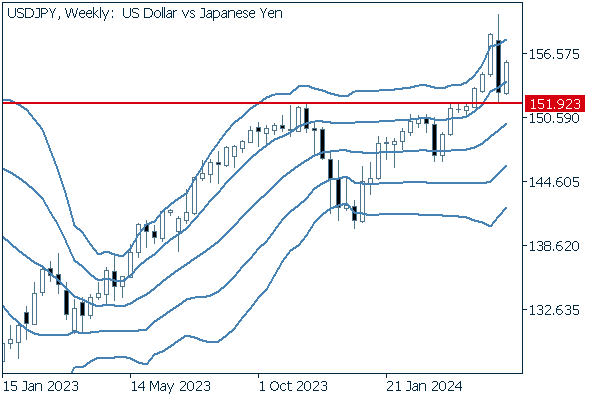

We can see that the 151.92 line is functioning well as a support. Since the middle line is also rising steadily on a weekly basis and the USDJPY is above the +1 standard deviation Bollinger Band, it is possible that the pair will continue its bandwalk.
EURUSD
For the euro, the Eurozone will release its GDP on Wednesday and its Harmonised Index of Consumer Prices on Friday. Like with its dollar cousin, the initial timing and pace of interest rate cuts for the euro are also attracting attention, so if the results of these high-profile economic indicators fall below expectations, there may be a case for a rate cut.
Next is an analysis of the EURUSD daily chart.
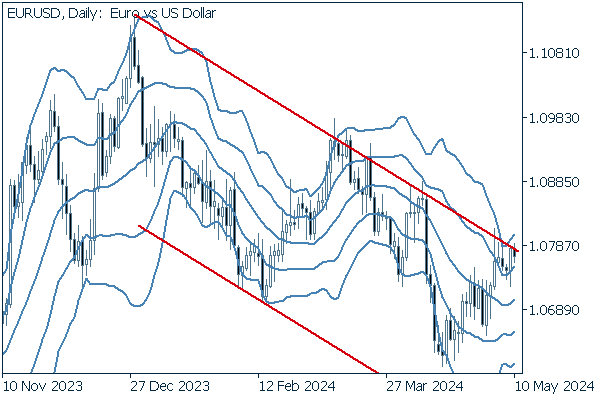

A bird's-eye view confirms that the price continues to be suppressed by a line sloping down to the right. Traders are likely looking to identify a reversal of the ongoing trend of a strong dollar and weak euro that has been going on since last year, a timing to build long-term positions.
We continue with an analysis of the EURUSD weekly chart.
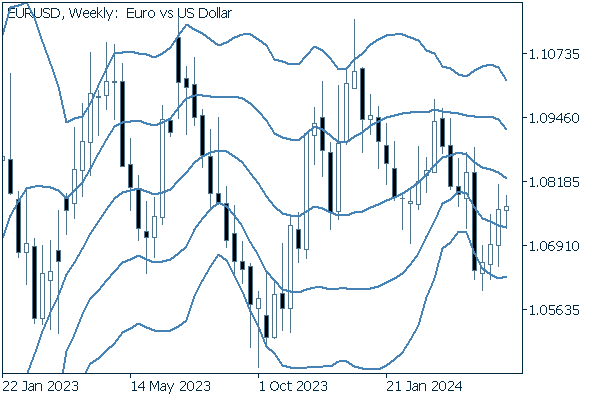

The weekly chart shows an unchanged view that the pair remains bound in a long-fixed price range.
GBPUSD
There are no major fundamentals related to the pound scheduled for the coming week.
Here is our analysis of the daily GBPUSD chart.
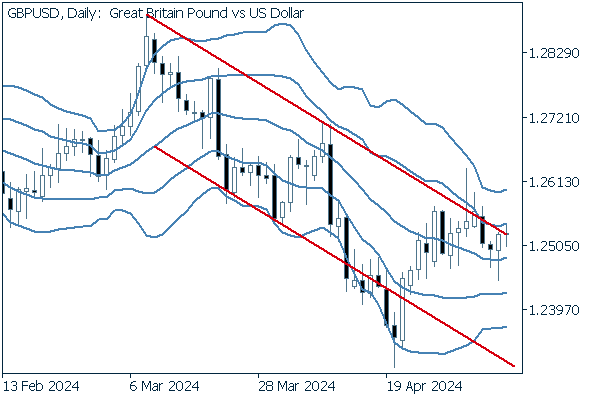

The daily chart appears to show the pair moving within a descending price channel. Traders will be keenly watching for a clear break above this channel.
We continue with an analysis of the GBPUSD weekly chart.
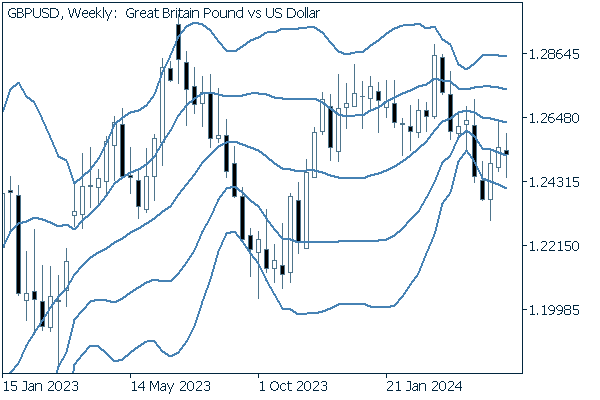

Like with the EURUSD, the GBPUSD appears to be range-bound on a weekly basis.
Was this article helpful?
0 out of 0 people found this article helpful.
Thank you for your feedback.
FXON uses cookies to enhance the functionality of the website and your experience on it. This website may also use cookies from third parties (advertisers, log analyzers, etc.) for the purpose of tracking your activities. Cookie Policy
