2024.05.27
- Features
-
Services/ProductsServices/ProductsServices/Products

Learn more about the retail trading conditions, platforms, and products available for trading that FXON offers as a currency broker.
You can't start without it.
Trading Platforms Trading Platforms Trading Platforms
Features and functionality comparison of MetaTrader 4/5, and correspondence table of each function by OS
Two account types to choose
Trading Account Types Trading Account Types Trading Account Types
Introducing FXON's Standard and Elite accounts.
close close

-
SupportSupportSupport

Support information for customers, including how to open an account, how to use the trading tools, and a collection of QAs from the help desk.
Recommended for beginner!
Account Opening Account Opening Account Opening
Detailed explanation of everything from how to open a real account to the deposit process.
MetaTrader4/5 User Guide MetaTrader4/5 User Guide MetaTrader4/5 User Guide
The most detailed explanation of how to install and operate MetaTrader anywhere.
FAQ FAQ FAQ
Do you have a question? All the answers are here.
Coming Soon
Glossary Glossary GlossaryGlossary of terms related to trading and investing in general, including FX, virtual currencies and CFDs.
News News News
Company and License Company and License Company and License
Sitemap Sitemap Sitemap
Contact Us Contact Us Contact Us
General, personal information and privacy inquiries.
close close

- Promotion
- Trader's Market
- Partner
-
close close
Learn more about the retail trading conditions, platforms, and products available for trading that FXON offers as a currency broker.
You can't start without it.
Features and functionality comparison of MetaTrader 4/5, and correspondence table of each function by OS
Two account types to choose
Introducing FXON's Standard and Elite accounts.
Support information for customers, including how to open an account, how to use the trading tools, and a collection of QAs from the help desk.
Recommended for beginner!
Detailed explanation of everything from how to open a real account to the deposit process.
The most detailed explanation of how to install and operate MetaTrader anywhere.
Do you have a question? All the answers are here.
Coming Soon
Glossary of terms related to trading and investing in general, including FX, virtual currencies and CFDs.
General, personal information and privacy inquiries.
Useful information for trading and market information is posted here. You can also view trader-to-trader trading performance portfolios.
Find a trading buddy!
Share trading results among traders. Share operational results and trading methods.
- Legal Documents TOP
- Client Agreement
- Risk Disclosure and Warning Notice
- Order and Execution Policy
- Complaints Procedure Policy
- AML/CFT and KYC Policy
- Privacy Policy
- eKYC Usage Policy
- Cookies Policy
- Website Access and Usage Policy
- Introducer Agreement
- Business Partner Agreement
- VPS Service Terms and Condition

This article was :
published
updated
Weekly FX Market Review and Key Points for the Week Ahead
Currency exchange markets in the past week have been characterized by a strengthening dollar. The only high-profile economic data release during the week was the number of new home sales in the U.S.; however, there were several comments from monetary officials suggesting caution against a rate cut before the end of the year.
In addition, the FOMC meeting minutes released on Wednesday, May 22 indicated the need to maintain high interest rates, even hinting at the potential for a rate hike, if conditional.
This confluence of market conditions led to a shyly but steadily rising USDJPY, extending from the mid-155 territory to just below 157. The rising dollar also drove down the EURUSD, hitting a low of 1.0804 on Thursday before rebounding sharply on Friday. However, the GBPUSD was somewhat more meandering and less clear in its movements.
On Thursday, May 23, data was released for U.S. new home sales, as mentioned above. Data fell well below expectations, with annualized new home sales of 634,000 vs. 679,000 expected, a month-on-month change of -4.7% vs. -2.1% expected. Several other U.S. economic indicators, including new unemployment claims, were released around midday afternoon GMT on Thursday, resulting in wild fluctuations in the USDJPY.
On Friday, May 24, Japan's Consumer Price Index (CPI) data was released for April. Year on year, this was a growth of 2.5% versus an expected 2.4%. When excluding fresh food, year-on-year growth was 2.2%, matching a forecast of 2.2%. When excluding both fresh food and energy, year-on-year growth also matched expectations, at 2.4% versus a forecast of 2.4%.
Economic Indicators and Statements to Watch this Week
(All times are in GMT)
May 30 (Thu)
12:30, U.S.: January-March quarterly real gross domestic product (revised GDP, quarter-on-quarter annualized data)
May 31 (Fri)
09:00, Europe: May Harmonised Index of Consumer Prices (preliminary HICP, year-on-year data)
09:00, Europe: May Harmonised Index of Consumer Prices (preliminary HICP core index, year-on-year data)
12:30, U.S.: April personal consumption expenditures (PCE deflator, year-on-year data)
12:30, U.S.: April personal consumption expenditures (core PCE deflator, excluding food and energy, month-on-month data)
12:30, U.S.: April personal consumption expenditures (core PCE deflator, excluding food and energy, year-on-year data)
The upcoming week's highlight is the U.S. personal consumption expenditures (PCE) on Friday. The Fed's increasingly cautious stance on interest rate cuts has led to dollar buying, which in turn has led to a rise in the USDJPY and a fall in the EURUSD. The PCE will have significant influence on whether this dollar-buying trend will continue or reverse course.
This Week's Forecast
The following currency pair charts are analyzed using an overlay of the ±1 and ±2 standard deviation Bollinger Bands, with a period of 20 days.
USDJPY
The CME's FedWatch tool shows a 99.1% probability that the FOMC will leave rates unchanged at the June 21 FOMC meeting, and this is very likely to be the case, barring any unforeseen major developments before the meeting.
As for the July 31 FOMC meeting, the tool shows a still-overwhelming 88.0% chance of unchanged interest rates. Note that the tool also includes a potential rate hike, though with a very slight probability at 0.8%.
The data become more interesting when looking at the September 18 FOMC meeting, where the tool has unchanged rates and a rate cut neck and neck, at 49.3% and 50.3% respectively.
The probability of unchanged rates finally drops off for the November 24 FOMC meeting, with a reading of 36.6%.
This retreat in interest rate cut expectations is also evident in the chart of the USDJPY. The combination of the Bank of Japan's currency intervention and weak economic indicators caused the pair to plunge below 152 during Japan's Golden Week holidays, but the pair has since been moving steadily higher.
Currency exchange charts are drawn based on a total incorporation of all available data. This means that trades must be cautious of new data that could change the direction of these charts, that is, high-profile economic indicators. This week, the high-profile economic indicator to watch is the U.S. PCE.
Next is an analysis of the USDJPY daily chart.
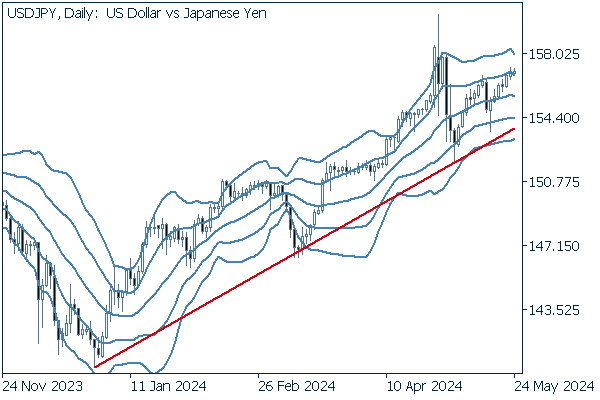

The pair continues its overall uptrend along a clean upward trend line drawn from the support just above 140, marked at the end of 2023. Even after the most recent decline during Japan's Golden Week holidays, the pair has been in an overall steady climb, marking higher highs and lows.
The middle Bollinger Band has also been in a near-constant upward posture for quite some time, leading to the conclusion that there is strong upward pressure for the pair.
We continue with an analysis of the USDJPY weekly chart.
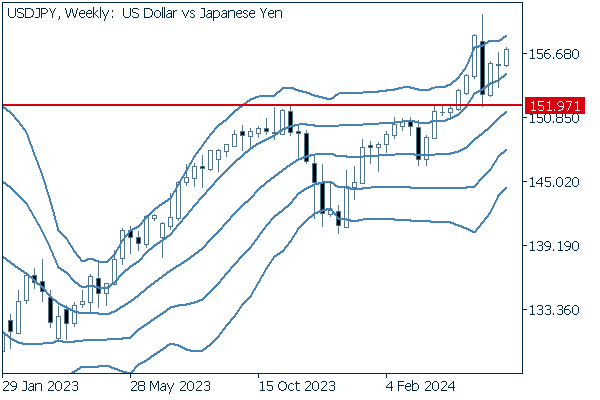

On a weekly basis, the pair has only closed down on four occasions since marking its low at the end of 2023. This perspective also suggests quite a strong upward momentum.
So long as the pair remains above 151.97, the most recent low, a bullish analysis is justifiable.
EURUSD
Perhaps the most notable release for the euro this week will be the Harmonised Index of Consumer Prices, to be announced on Wednesday, May 31st. Any signs of receding inflation would become a driver for selling the euro, so traders with positions related to the currency should keep a keen eye on this release.
Next is an analysis of the EURUSD daily chart.
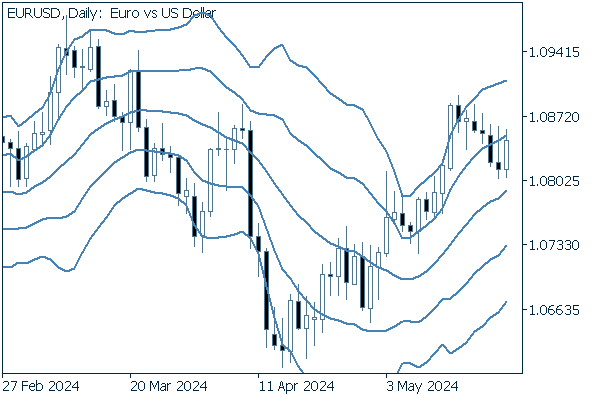

Since the pair is now closing below the +1 standard deviation Bollinger Band, it would not be surprising to see further downward adjustment.
We continue with an analysis of the EURUSD weekly chart.
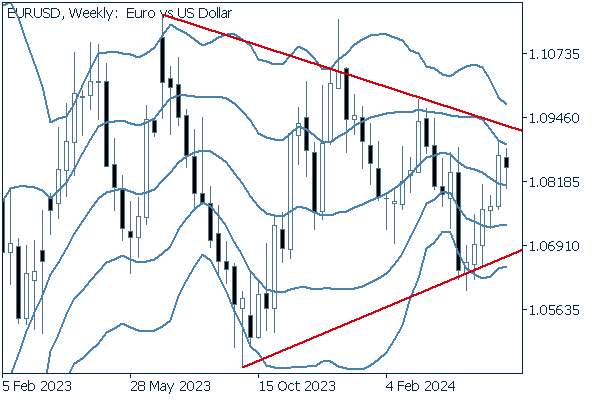

Weekly data show falling highs and rising lows as the pair trades in an ever-tightening triangle formation.
GBPUSD
This upcoming week holds no major releases driving trends for the pound.
Now, we analyze the daily GBPUSD chart.
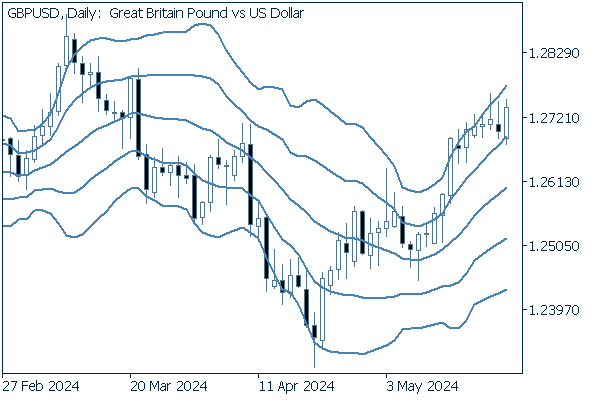

Unlike the EURUSD, the GBPUSD continues its bandwalk, as the pair trades above the +1 standard deviation Bollinger Band.
We continue with an analysis of the GBPUSD weekly chart.
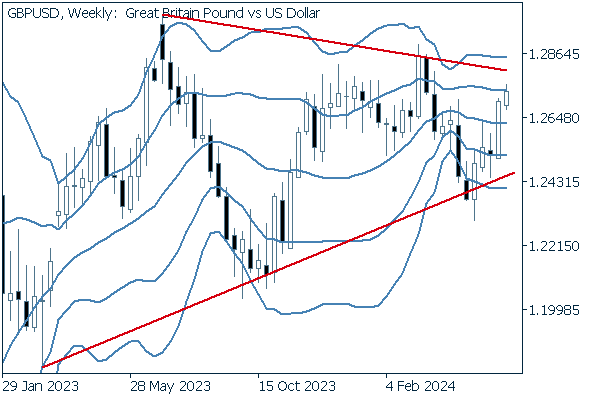

Here, the GBPUSD demonstrates a triangle formation much like the EURUSD. A serious break from this triangular trading could well mark a new, core trend that would be measured in years rather than months.
Was this article helpful?
0 out of 0 people found this article helpful.
Thank you for your feedback.
FXON uses cookies to enhance the functionality of the website and your experience on it. This website may also use cookies from third parties (advertisers, log analyzers, etc.) for the purpose of tracking your activities. Cookie Policy
