2024.05.06
- Features
-
Services/ProductsServices/ProductsServices/Products

Learn more about the retail trading conditions, platforms, and products available for trading that FXON offers as a currency broker.
You can't start without it.
Trading Platforms Trading Platforms Trading Platforms
Features and functionality comparison of MetaTrader 4/5, and correspondence table of each function by OS
Two account types to choose
Trading Account Types Trading Account Types Trading Account Types
Introducing FXON's Standard and Elite accounts.
close close

-
SupportSupportSupport

Support information for customers, including how to open an account, how to use the trading tools, and a collection of QAs from the help desk.
Recommended for beginner!
Account Opening Account Opening Account Opening
Detailed explanation of everything from how to open a real account to the deposit process.
MetaTrader4/5 User Guide MetaTrader4/5 User Guide MetaTrader4/5 User Guide
The most detailed explanation of how to install and operate MetaTrader anywhere.
FAQ FAQ FAQ
Do you have a question? All the answers are here.
Coming Soon
Glossary Glossary GlossaryGlossary of terms related to trading and investing in general, including FX, virtual currencies and CFDs.
News News News
Company and License Company and License Company and License
Sitemap Sitemap Sitemap
Contact Us Contact Us Contact Us
General, personal information and privacy inquiries.
close close

- Promotion
- Trader's Market
- Partner
-
close close
Learn more about the retail trading conditions, platforms, and products available for trading that FXON offers as a currency broker.
You can't start without it.
Features and functionality comparison of MetaTrader 4/5, and correspondence table of each function by OS
Two account types to choose
Introducing FXON's Standard and Elite accounts.
Support information for customers, including how to open an account, how to use the trading tools, and a collection of QAs from the help desk.
Recommended for beginner!
Detailed explanation of everything from how to open a real account to the deposit process.
The most detailed explanation of how to install and operate MetaTrader anywhere.
Do you have a question? All the answers are here.
Coming Soon
Glossary of terms related to trading and investing in general, including FX, virtual currencies and CFDs.
General, personal information and privacy inquiries.
Useful information for trading and market information is posted here. You can also view trader-to-trader trading performance portfolios.
Find a trading buddy!
Share trading results among traders. Share operational results and trading methods.
- Legal Documents TOP
- Client Agreement
- Risk Disclosure and Warning Notice
- Order and Execution Policy
- Complaints Procedure Policy
- AML/CFT and KYC Policy
- Privacy Policy
- eKYC Usage Policy
- Cookies Policy
- Website Access and Usage Policy
- Introducer Agreement
- Business Partner Agreement
- VPS Service Terms and Condition

This article was :
published
updated
Weekly FX Market Review and Key Points for the Week Ahead
In the past week, the USDJPY plunged from a high around 160 to as far as below 152 due to sharp yen buying that appeared to be the result of multiple currency interventions. This differential of more than 800 pips in a single week marks a historic fluctuation. Let's take a look at price movements for this and other currency pairs through the week.
Monday, April 29 was a national holiday in Japan (Showa Day), leading to thin trading in Tokyo. Amid this, the USDJPY began a fiercely bullish rally in the morning session. Just after GMT 01:30, the pair reached a high of 160.21, breaking above 160 for the first time in 34 years.
However, the USDJPY then plunged sharply, hitting a low of 155.04 during roughly one hour from around GMT 04:00. The downward pressure remained strong after this, with the pair nearing 154 as of GMT 05:00. Bank of Japan data revealed that this sharp yen buying could be caused by a 5.5 trillion yen foreign exchange intervention.
On Tuesday, April 30, preliminary data for the Eurozone's April Harmonised Index of Consumer Prices were released, showing 2.4% year-on-year growth matching an expected 2.4%. In addition, the core index indicated 2.7% year-on-year growth versus a 2.6% forecast. Preliminary U.S. GDP data was also released around the same time, with month-on-month growth of 0.3% versus 0.2% expected, and year-on-year growth of 0.4% versus 0.2% expected.
The U.S. also released quarterly employment cost index data for January to March, showing quarter-on-quarter growth of 1.2% versus 1.0% expected. The Fed is said to be focusing on employment costs, and this better-than-expected result has given the dollar a temporary buying tailwind.
On Wednesday, May 1, the U.S. April ADP National Employment Report was released alongside the April ISM Manufacturing PMI. While the jobs report exceeded expectations, the manufacturing PMI did not.
Later on Wednesday, the FOMC announced it would not change the Fed policy rate, matching expectations. The subsequent press conference by Fed Chairman Jerome Powell demonstrated an attitude toward maintaining current interest rates for some time; however, the option for a rate cut by the end of the year was not ruled out.
After the FOMC meeting, in the early morning Japan time, there appeared to be another round of currency intervention and the USDJPY hit a low of 153.01.
On Friday, May 3, the U.S. jobs report was released for April. Overall, the report fell short of expectations; nonfarm payrolls only rose 175,000 versus an expected 243,000, the unemployment rate was 3.9% versus an expected 3.8%, and the average hourly earnings rose 0.2% month on month versus 0.3% expected and 3.9% year on year versus 4.0% expected. This caused the USDJPY to fall, hitting a low of 151.85.
In this rocky week for the USDJPY, the EURUSD reversed out of a 1.0649 bottom, its Wednesday low, to reach a high of 1.0812 on Friday. The GBPUSD also showed an upward trend, though without the same degree of momentum as in the EURUSD. Both bullish trends are likely due to dollar selling.
Economic Indicators and Statements to Watch this Week
(All times are in GMT)
May 9 (Thu)
11:00, U.K.: Bank of England (BOE) policy interest rate announcement
11:00, U.K.: Bank of England Monetary Policy Committee (MPC) meeting
May 10 (Fri)
06:00, U.K.: January-March quarterly gross domestic product (preliminary GDP, quarter-on-quarter data)
06:00, U.K.: January-March quarterly gross domestic product (preliminary GDP, year-on-year data)
06:00, U.K.: March monthly gross domestic product (GDP, month-on-month data)
11:30, Europe: European Central Bank (ECB) Governing Council meeting agenda
Unlike the eventful week behind, the week ahead has fewer key developments to watch.
This Week's Forecast
The following currency pair charts are analyzed using an overlay of the ±1 and ±2 standard deviation Bollinger Bands, with a period of 20 days.
USDJPY
The USDJPY dropped from the 160 range to the 153 range, approximately, in the course of a single week. These developments make it exceedingly challenging to predict future market movements, meaning it is highly advisable to watch movements until an overarching trend is revealed.
At the very least, any trade that relies on currency intervention will come with significant risk.
Next is an analysis of the USDJPY daily chart.
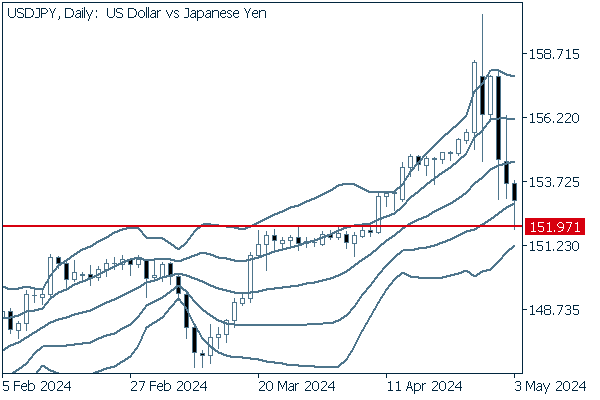

After bouncing off the resistance high just below 152 for over a week, the pair broke past and rapidly shifted to an upward bandwalk with almost all positive candlesticks. The pair closed Friday, April 26 with an enormous positive candlestick, but has been on the downtrend almost entirely since reaching 160 on Monday.
Finally, we can also see that the former resistance line just below 152 yen has now become a support.
We continue with an analysis of the USDJPY weekly chart.
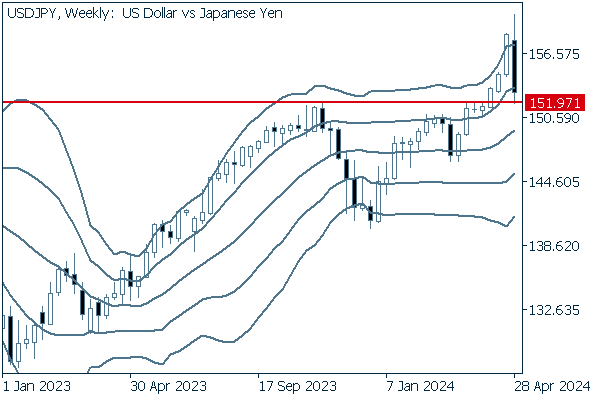

The weekly chart also reveals that the line just below 152 served as a resistance for the pair to bounce off of last fall.
Whether or not the pair can close below this line may reveal where this trend is going.
EURUSD
For the euro, the European Central Bank (ECB) Governing Council's meeting agenda is to be announced on Friday, May 10. This will be watched for clues as to when interest rate cuts could begin.
Next is an analysis of the EURUSD daily chart.
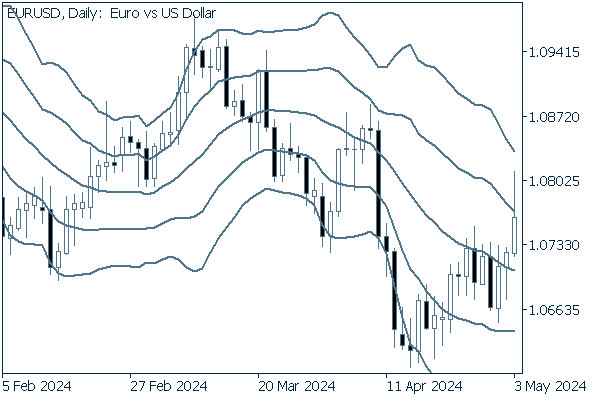

On Friday, May 3, the EURUSD corrected, but closed up, leaving long upper whiskers after nearing the +2 standard deviation Bollinger Band. With a downward sloping middle Bollinger Band, we can conclude that there is an overall bearish trend.
We continue with an analysis of the EURUSD weekly chart.
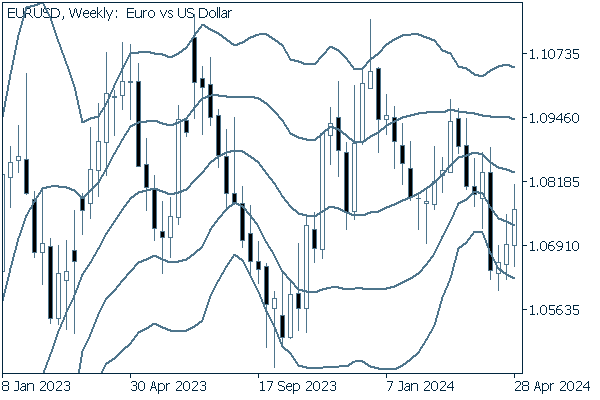

Weekly data show that the pair is still trading in quite a broad range.
Regardless, this pair has not seen the same extreme level of fluctuations as with the USDJPY.
GBPUSD
For the pound, on Friday, May 10, the U.K. is to release its quarterly gross domestic product for January to March and its monthly GDP for March.
Now, we analyze the daily GBPUSD chart.
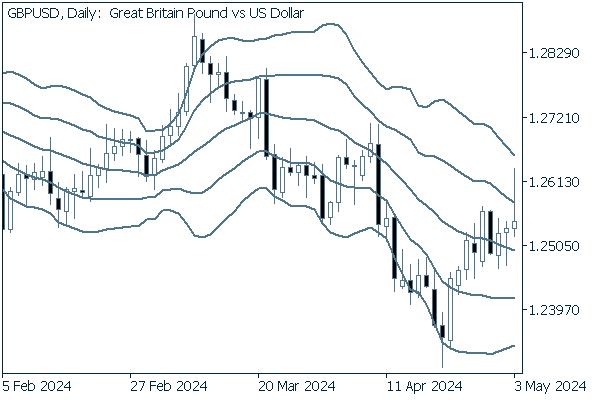

The pair demonstrated similar moves to the EURUSD, correcting to leave long upper whiskers. Most recently, the price has broken above the -1 standard deviation Bollinger Band, indicating an upward trend.
We continue with an analysis of the GBPUSD weekly chart.
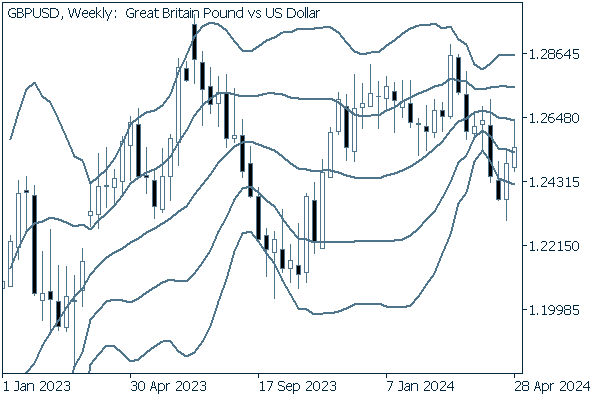

Like its EURUSD cousin, the GBPUSD's weekly price also appears range-bound.
Was this article helpful?
0 out of 0 people found this article helpful.
Thank you for your feedback.
FXON uses cookies to enhance the functionality of the website and your experience on it. This website may also use cookies from third parties (advertisers, log analyzers, etc.) for the purpose of tracking your activities. Cookie Policy
