2024.04.29
This article was :
published
updated
Weekly FX Market Review and Key Points for the Week Ahead
The currency market in the past week has been characterized by an overwhelmingly weakening yen.
The first half of the week was expected to be dominated by a wait-and-see attitude, given the high-profile events later in the week. Notably, Friday the 26th marked both the Bank of Japan's monetary policy meeting and the data release of the U.S. personal consumption expenditures (PCE). Despite this, the USDJPY maintained a gradual strengthening pattern.
On Tuesday, April 23, data was released for U.S. new home sales in March. Annualized new home sales were 693,000 versus 670,000 expected, with a month-on-month change of 8.8% vs. 1.2% expected.
On Thursday, April 25, the U.S. released its annualized quarter-on-quarter data for quarterly real GDP (flash data) from January to March, showing an increase of 1.6% vs. 2.4% expected.
Then, on Friday, April 26, the Bank of Japan held its monetary policy meeting and its post-meeting policy rate announcement. The BOJ elected to defer any additional rate hikes and maintained monetary policy at the current level.
Though this announcement was in line with market expectations, it also confirmed that the vast interest rate differential between Japan and the U.S. will not narrow in the foreseeable future. From around GMT 03:20 on Friday, the dollar began to rise sharply, hitting the 156-yen level by GMT 03:40.
At GMT 06:30, Bank of Japan Governor Ueda gave a press conference, where he commented that the yen depreciation had not yet significantly influenced underlying prices. The dollar began to surge again around this press conference, reaching a high of 156.82 yen at GMT 07:00.
Just after, the USDJPY pair temporarily plunged to the 154 level, but rapidly rebounded in a V-shaped reversal, leaving long lower whiskers behind. The pair reached a high of 158.44, the weakest for the yen in 34 years, just before the end of the New York session.
Also released on the same day was the U.S. personal consumption expenditures (PCE) data for March, with results slightly higher than expected.
Economic Indicators and Statements to Watch this Week
(All times are in GMT)
April 30 (Tue)
09:00, Europe: April Harmonised Index of Consumer Prices (preliminary HICP, year-on-year data)
09:00, Europe: April Harmonised Index of Consumer Prices (preliminary HICP core index, year-on-year data)
09:00, Europe: January-March quarterly regional gross domestic product (flash regional GDP, quarter-on-quarter data)
09:00, Europe: January-March quarterly regional gross domestic product (flash regional GDP, year-on-year data)
12:30, U.S.: January-March quarterly employment cost index (quarter-on-quarter data)
May 1 (Wed)
12:15, U.S.: April ADP National Employment Report (month-on-month data)
14:00, U.S.: April ISM Manufacturing PMI
18:00, U.S.: Federal Reserve Open Market Committee (FOMC) meeting, post-meeting policy rate announcement
18:30, U.S.: Regular press conference by Federal Reserve Chairman Jerome Powell
23:50, Japan: Bank of Japan monetary policy meeting agenda
May 3 (Fri)
12:30, U.S.: April change in nonfarm payrolls (month-on-month data)
12:30, U.S.: April unemployment rate
12:30, U.S.: April average hourly earnings (month-on-month data)
12:30, U.S.: April average hourly earnings (year-on-year data)
14:00, U.S.: April ISM Non-Manufacturing PMI (composite)
The coming week is another week of many important economic indicators, headlined by the U.S. jobs report on Friday, May 3.
This Week's Forecast
The following currency pair charts are analyzed using an overlay of the ±1 and ±2 standard deviation Bollinger Bands, with a period of 20 days.
USDJPY
As already mentioned, the USDJPY pair has broken past 158 into historic highs. Cross-yen pairs such as the EURJPY and GBPJPY have also surged, but there is yet no such clear trend for the EURUSD or GBPUSD. This demonstrates that the yen is the sole currency being overwhelmingly sold.
The FOMC meeting is scheduled for May 1, and according to the CME's FedWatch tool, the key policy rate is almost certain to remain unchanged at a 97.6% chance. The tool also shows an 88.9% chance of rates remaining unchanged at the June FOMC meeting. It shows a 68.7% chance of unchanged rates for July as well, indicating a considerable retreat of market expectations for interest rate cuts.
Next is an analysis of the USDJPY daily chart.
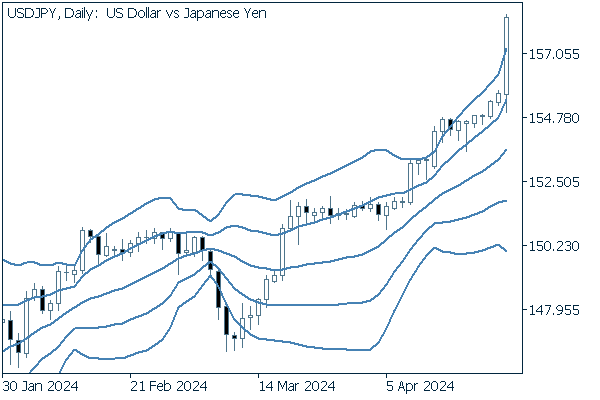
The rightmost candle for Friday shows by far the greatest rise of the currency pair. In the Bollinger Bands, we have gone from an upward bandwalk in progress to a sudden break above the +2 standard deviation band.
We continue with an analysis of the USDJPY weekly chart.
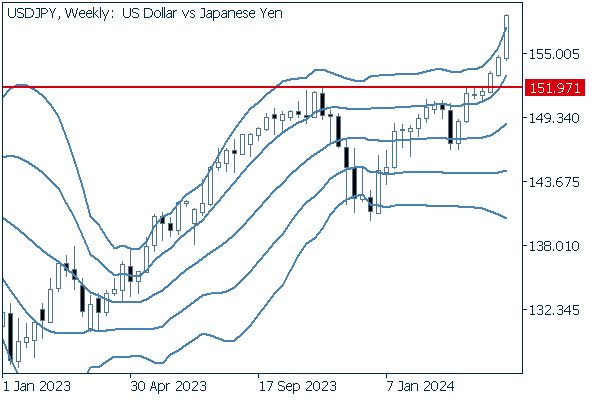
The pair has rallied three consecutive times since breaking above the previous high of 151.97. The rising middle Bollinger Band also suggests an upward bandwalk has begun.
EURUSD
For the EURUSD this week, Tuesday, April 30 is to mark the release of the Harmonised Index of Consumer Prices (HICP) for April and the quarterly gross regional product (regional GDP) for January-March.
Data should be watched for any clues as to the timing of rate cuts.
Next is an analysis of the EURUSD daily chart.
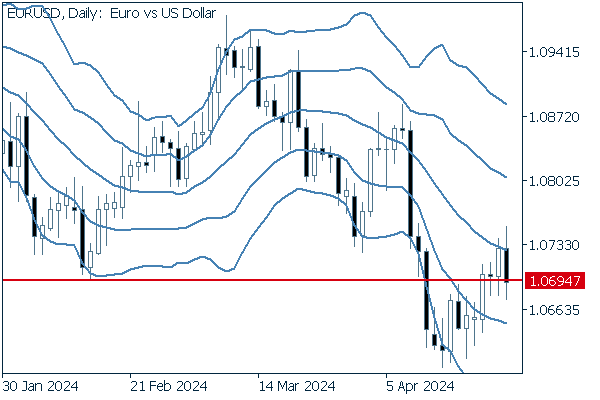
In its most recent decline, the pair faces a support level at 1.0694, a level it broke below on April 12th before crossing above once again. This suggests a potential uptrend in the pair going forward.
We continue with an analysis of the EURUSD weekly chart.
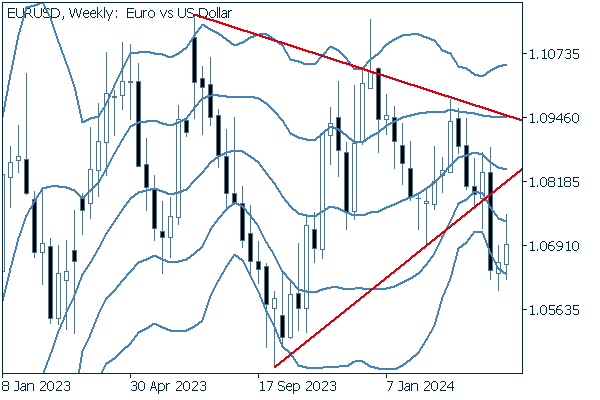
After breaking below its triangle formation, the pair has displayed two positive candles. Still, the pair does not appear to have strong upward momentum.
GBPUSD
Last week, the GBPUSD bottomed out at 1.2299 on Monday and then began to reverse higher, marking both highs and lows. The pair reached the week's intra-day high of 1.2451 on Friday.
Now, we analyze the daily GBPUSD chart.
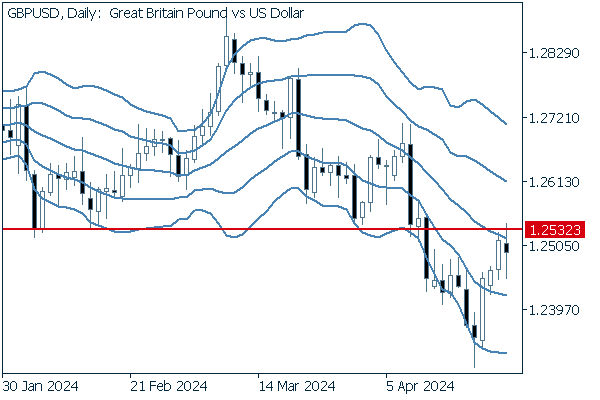
The pair, which has broken below 1.2532, now finds that same level serving as a resistance. The middle Bollinger Band also shows a downward slope, garnering interest about a possible continued downtrend for the pair.
We continue with an analysis of the GBPUSD weekly chart.
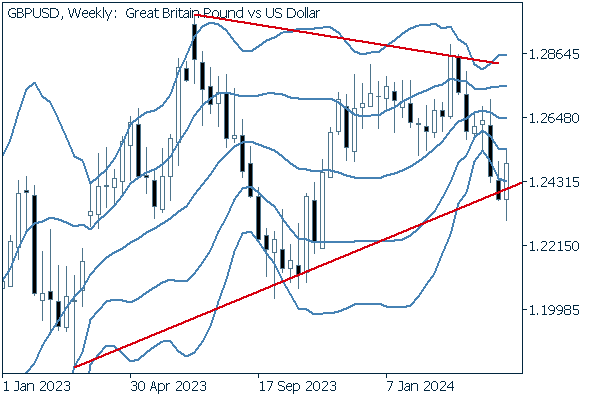
After breaking below the lower line of a triangle formation, the pair reversed back within the triangle.
Was this article helpful?
0 out of 0 people found this article helpful.
Thank you for your feedback.
Send