2024.04.22
This article was :
published
updated
Weekly FX Market Review and Key Points for the Week Ahead
Markets in the week ending April 21 displayed yet another round of dollar appreciation. This was a theme established early in the week, with the morning of Monday, April 15 seeing the USDJPY break above recent highs and build higher past 154.
The pair was jittery after this breakout, with many long whiskers caused by sharp drops of 50 to 100 pips followed by rapid returns over several iterations.
Meanwhile, the EURUSD continued to wander aimlessly, while the GBPUSD fell to a new low on Friday, April 19.
In this article, we take a look at these market moves for the week.
On Monday, April 15, the U.S. released its retail data for March, with 0.7% month-on-month growth beating a 0.3% forecast. When excluding the automotive sector, month-on-month growth was 1.1% versus a forecast of 0.4%, providing tailwinds sending the USDJPY to a high of 154.44. Still, retail sales did not clearly build trends for the EURUSD or GBPUSD pairs.
In statements on Tuesday, April 16, Federal Reserve Chairman Jerome Powell provided impetus for dollar-buying activity. He indicated a strong chance that inflation will continue for a little while to come given recent economic indicators, and that it will take more time to gain the necessary confidence to cut interest rates.
On Wednesday, April 17, the Eurozone released revised data for the March Harmonised Index of Consumer Prices (HICP). The overall data and core index both aligned with market expectations.
On Friday, April 19, Japan's Consumer Price Index (CPI) data was released for March. Overall, year-on-year growth was 2.7% versus a forecast of 2.8%, which when excluding fresh food was 2.6% versus a forecast of 2.6%. When excluding both fresh food and energy, year-on-year growth was 2.9% versus a forecast of 3.0%.
Economic Indicators and Statements to Watch this Week
(All times are in GMT)
April 23 (Tue)
14:00, U.S.: March new home sales (annualized)
14:00, U.S.: March new home sales (MoM)
April 25 (Thu)
12:30, U.S.: January-March quarterly real gross domestic product (preliminary GDP, quarter-on-quarter annualized data)
April 26 (Fri)
Japan: Bank of Japan Monetary Policy Meeting, post-meeting policy rate announcement
Japan: Bank of Japan Outlook Report
06:30, Japan: Regular press conference by Bank of Japan Governor Kazuo Ueda
12:30, U.S.: March personal consumption expenditures (PCE deflator, year-on-year data)
12:30, U.S.: March personal consumption expenditures (core PCE deflator, excluding food and energy, month-on-month data)
12:30, U.S.: March personal consumption expenditures (core PCE deflator, excluding food and energy, year-on-year data)
On April 26, the Bank of Japan will hold its Monetary Policy Meeting and announce Japan's policy rate, which is likely to remain unchanged. Governor Ueda's comments should be watched for comments hinting at the timing of a potential rate cut before the end of the year.
This Week's Forecast
The following currency pair charts are analyzed using an overlay of the ±1 and ±2 standard deviation Bollinger Bands, with a period of 20 days.
USDJPY
The pair faces challenging developments; lingering at multi-decade highs suggests currency intervention by the Bank of Japan.
This week's highlight is the U.S. personal consumption expenditures (PCE) data release on the 26th. This economic indicator shows inflation progression, and stronger-than-expected data would trigger a retreat in expectations of an interest rate cut.
Next is an analysis of the USDJPY daily chart.
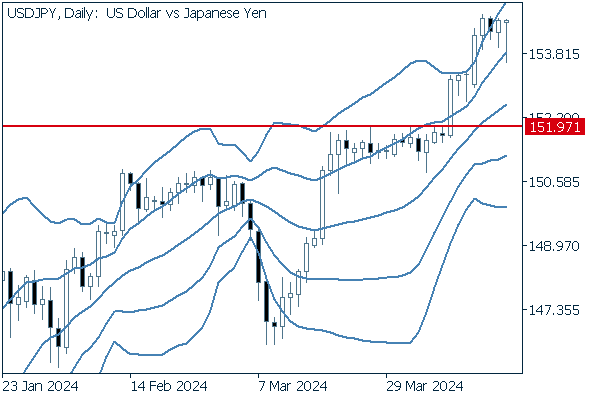
Since breaking above 152, the pair has moved into an upward bandwalk between the +1 and +2 standard deviation Bollinger Bands. This chart demonstrates a rising middle line and building upper and lower band widths, a shape that can be deemed to signify the onset of an uptrend.
We continue with an analysis of the USDJPY weekly chart.
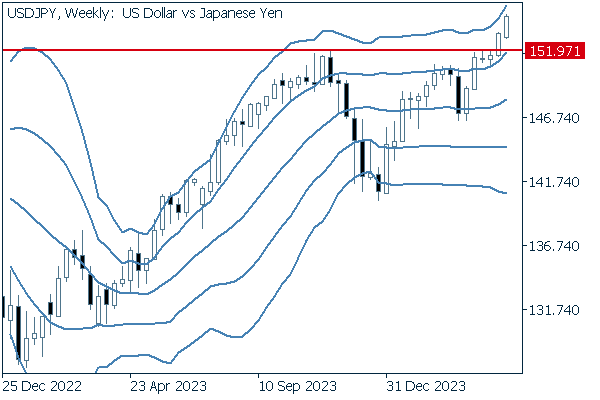
Looking at the weekly chart, the pair similarly shows two consecutive tall positive candles after breaking through the high of 151.97. Furthermore, the middle Bollinger Band is rising to an upward angle and there appears to be expanding upper and lower band widths, suggesting the opening steps of a bullish trend.
EURUSD
The market is beginning to price in an ECB rate cut in June, but some believe that the dollar and interest rate cuts should be aligned, creating uncertainty for the summer and thereafter.
Next is an analysis of the EURUSD daily chart.
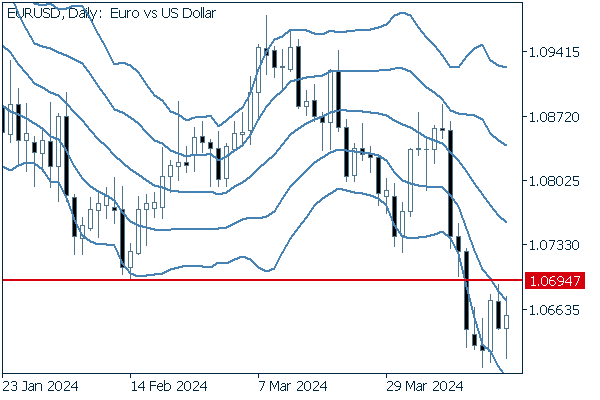
The pair has fallen below the recent low of 1.0694 and is now moving between the -1 and -2 standard deviation Bollinger Bands. The middle line is also sloping downward, showing a bear market (i.e., the dollar appreciating against the euro).
We continue with an analysis of the EURUSD weekly chart.
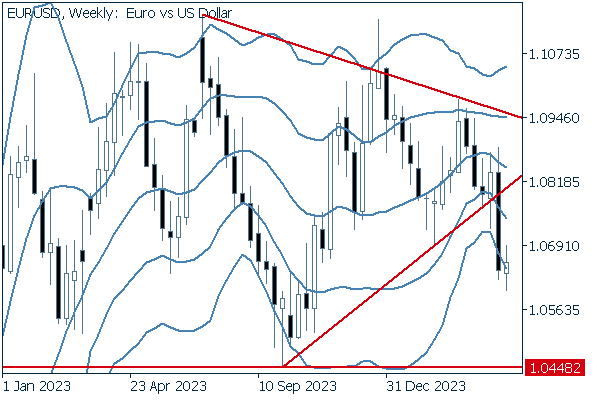
The chart shows that selling pressure is strong on a weekly basis as well since the pair has broken below its triangle formation.
On the longer term, traders will be watching to see if the pair will test the key support at 1.0448.
GBPUSD
Persistent inflation in the United Kingdom has kept expectations dampened for a Bank of England (BOE) rate cut keeping pace with its euro counterpart.
Now, we analyze the daily GBPUSD chart.
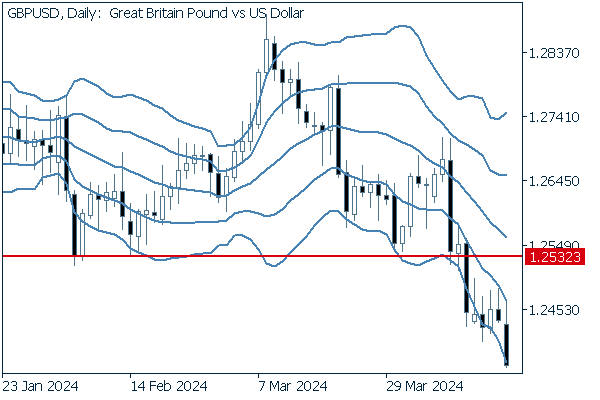
Pound-sellers have gained even further momentum since breaking through the support low of 1.2532. With the market in a descending bandwalk, a sell strategy is likely to be effective in the near term.
We continue with an analysis of the GBPUSD weekly chart.
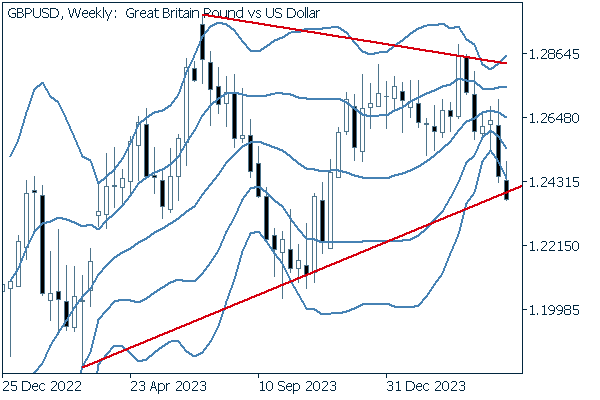
The pair threatens to break below its triangle formation, and traders will be keenly watching price actions this week and beyond to determine if this is a breakout or not. In either case, market sentiment appear to weigh more heavily toward the sell-side.
Was this article helpful?
0 out of 0 people found this article helpful.
Thank you for your feedback.
Send