2024.04.15
- Features
-
Services/ProductsServices/ProductsServices/Products

Learn more about the retail trading conditions, platforms, and products available for trading that FXON offers as a currency broker.
You can't start without it.
Trading Platforms Trading Platforms Trading Platforms
Features and functionality comparison of MetaTrader 4/5, and correspondence table of each function by OS
Two account types to choose
Trading Account Types Trading Account Types Trading Account Types
Introducing FXON's Standard and Elite accounts.
close close

-
SupportSupportSupport

Support information for customers, including how to open an account, how to use the trading tools, and a collection of QAs from the help desk.
Recommended for beginner!
Account Opening Account Opening Account Opening
Detailed explanation of everything from how to open a real account to the deposit process.
MetaTrader4/5 User Guide MetaTrader4/5 User Guide MetaTrader4/5 User Guide
The most detailed explanation of how to install and operate MetaTrader anywhere.
FAQ FAQ FAQ
Do you have a question? All the answers are here.
Coming Soon
Glossary Glossary GlossaryGlossary of terms related to trading and investing in general, including FX, virtual currencies and CFDs.
News News News
Company and License Company and License Company and License
Sitemap Sitemap Sitemap
Contact Us Contact Us Contact Us
General, personal information and privacy inquiries.
close close

- Promotion
- Trader's Market
- Partner
-
close close
Learn more about the retail trading conditions, platforms, and products available for trading that FXON offers as a currency broker.
You can't start without it.
Features and functionality comparison of MetaTrader 4/5, and correspondence table of each function by OS
Two account types to choose
Introducing FXON's Standard and Elite accounts.
Support information for customers, including how to open an account, how to use the trading tools, and a collection of QAs from the help desk.
Recommended for beginner!
Detailed explanation of everything from how to open a real account to the deposit process.
The most detailed explanation of how to install and operate MetaTrader anywhere.
Do you have a question? All the answers are here.
Coming Soon
Glossary of terms related to trading and investing in general, including FX, virtual currencies and CFDs.
General, personal information and privacy inquiries.
Useful information for trading and market information is posted here. You can also view trader-to-trader trading performance portfolios.
Find a trading buddy!
Share trading results among traders. Share operational results and trading methods.
- Legal Documents TOP
- Client Agreement
- Risk Disclosure and Warning Notice
- Order and Execution Policy
- Complaints Procedure Policy
- AML/CFT and KYC Policy
- Privacy Policy
- eKYC Usage Policy
- Cookies Policy
- Website Access and Usage Policy
- Introducer Agreement
- Business Partner Agreement
- VPS Service Terms and Condition

This article was :
published
updated
Weekly FX Market Review and Key Points for the Week Ahead
The currency market in the past week has been characterized by a strengthening dollar.
This came in the form of a rising USDJPY and falling EURUSD and GBPUSD, driven largely by forecast-beating data for the high-profile U.S. Consumer Price Index (CPI). This factor toward a strengthening dollar, combined with a building momentum toward a euro rate cut, has further pushed the EURUSD downward.
On Monday and Tuesday, April 8 and 9, there were no high-profile economic indicators or statements affecting markets.
The Wednesday, April 10 release of the U.S. Consumer Price Index (CPI) showed the following results.
- 0.4% month-on-month growth versus a 0.3% forecast, 3.5% year-on-year growth versus a 3.4% forecast
- Core index month-on-month growth of 0.4% versus a 0.3% forecast, year-on-year growth of 3.8% versus a 3.7% forecast
Confirmation that inflation is still on the rise sent the USDJPY surging from the high 151s past 153. Similarly, dollar-buying drove the EURUSD and GBPUSD down by about 150 to 200 pips each.
On Thursday, April 11, the European Central Bank (ECB) announced it would leave its policy rate for the euro unchanged at 4.5%, in line with expectations. ECB President Lagarde's following press conference also contained no nuance against a June rate cut, building momentum toward said rate cut.
The influence from this undertone can also be suggested from the fact that the USDJPY has remained high since the CPI release, while the EURJPY has conversely been in a downtrend.
On Friday, April 12, the U.K. released its month-on-month GDP data for February, with 0.1% growth matching a 0.1% forecast.
Economic Indicators and Statements to Watch this Week
(All times are in GMT)
April 15 (Mon)
12:30, U.S.: March retail sales (month-on-month data)
12:30, U.S.: March retail sales (month-on-month data, excluding automobiles)
April 16 (Tue)
17:15, U.S.: Press conference by Federal Reserve Chairman Jerome Powell
April 17 (Wed)
09:00, Europe: March Harmonised Index of Consumer Prices (revised HICP, year-on-year data)
09:00, Europe: March Harmonised Index of Consumer Prices (revised HICP core index, year-on-year data)
April 18 (Thu)
23:30, Japan: March Consumer Price Index, Japan (CPI, all items, year-on-year data)
23:30, Japan: March Consumer Price Index, Japan (CPI, all items less fresh food, year-on-year data)
23:30, Japan: March Consumer Price Index, Japan (CPI, all items less fresh food and energy, year-on-year data)
This Week's Forecast
The following currency pair charts are analyzed using an overlay of the ±1 and ±2 standard deviation Bollinger Bands, with a period of 20 days.
USDJPY
Strong CPI data have largely reduced expectations of a U.S. interest rate cut. The CME FedWatch tool shows a 94.1% probability of the FOMC keeping rates unchanged at its May meeting, suggesting a rate cut now is unlikely.
The tool also shows a 71.7% chance of rates remaining unchanged at the June FOMC meeting, well over 50%. The fact that these probabilities have jumped from 30.7% a month ago and 46.8% a week ago shows significant impact from the CPI data.
The CME FedWatch tool's predictions first fall below 50% in July, with a 43.5% chance the FOMC will announce an unchanged policy rate in that month.
Next is an analysis of the USDJPY daily chart.
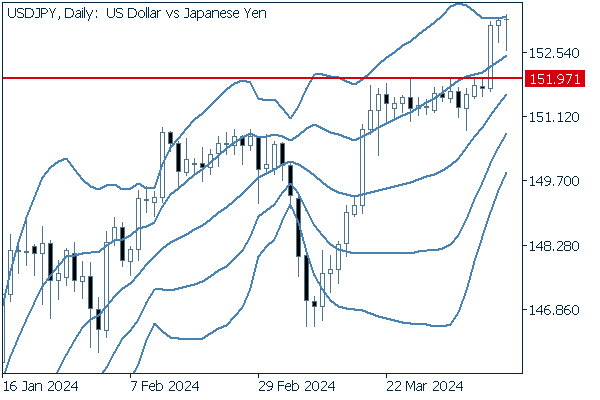

CPI data triggered a strong rally above the milestone 151.97 level, leading to a move above 153.
The middle line of the Bollinger Bands shows a firm 45-degree angle upward, confirming bullish momentum.
However, Bollinger Band width has not yet begun to expand, suggesting that any continuation of an uptrend will not be immediate.
We continue with an analysis of the USDJPY weekly chart.
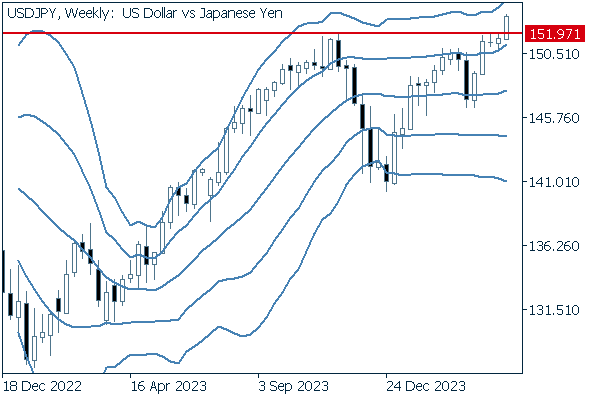

The pair has, in a single rally, shattered the 2024, 2023, and (though not in this chart) 2022 highs all at once.
Although each of the Bollinger Bands remain generally horizontal, there are signs that the middle line is rising to an upward angle and that the upper and lower band widths may expand, which may be the first signs of a full-fledged trend market.
EURUSD
As already mentioned, a June interest rate cut for the euro is inching closer toward reality. By contrast, with the U.S. dollar interest rate likely to be cut in the summer or thereafter, a case can be made for a trend where the euro is sold and the dollar bought, driving continued bearish momentum for the EURUSD pair.
Next is an analysis of the EURUSD daily chart.
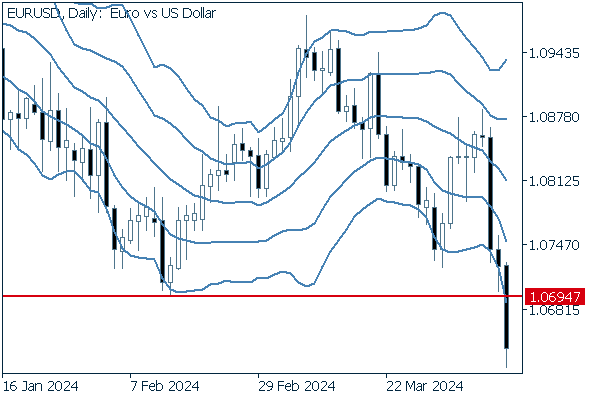

The latest close has entirely wiped out the recent intraday low of 1.06947. There is a possibility this steep bearish plot will retrace back toward the 1.06947 line.
We continue with an analysis of the EURUSD weekly chart.
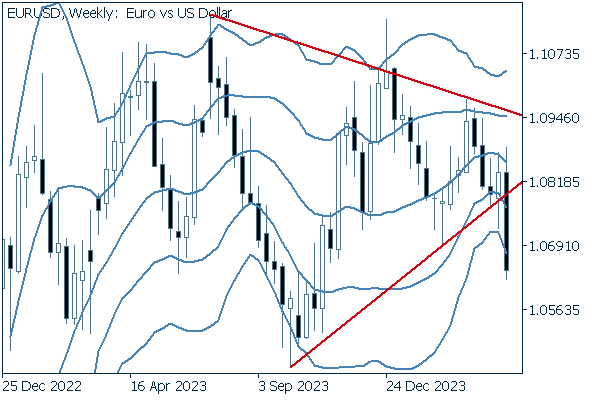

The weekly chart shows the pair breaking below the floor of its triangle formation. With signs of a widening interest rate differential, both daily and weekly charts demonstrate bearish patterns, combined with multiple fundamental sell-side factors.
This may offer an opportunity for those seeking gains on a short strategy.
GBPUSD
The pound tends to be strongly influenced by the euro due to its close geographic proximity and strong economic and political ties. Hence, the GBPUSD chart demonstrates some similar movement patterns to its EURUSD counterpart.
Here is our analysis of the daily GBPUSD chart.
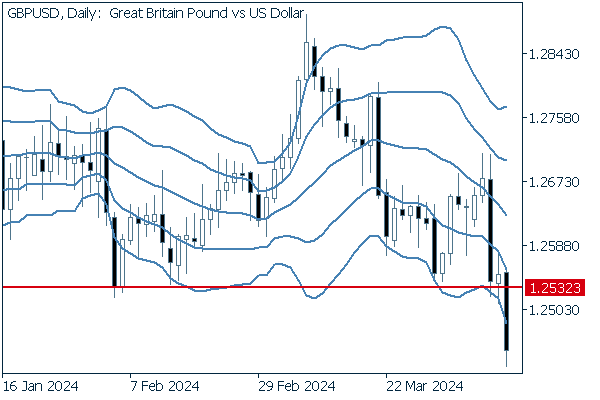

Like the EURUSD, the pair has closed significantly below its most recent intraday low of 1.25323. Furthermore, the middle Bollinger Band has turned downward, suggesting a potential bear market ahead.
We continue with an analysis of the GBPUSD weekly chart.
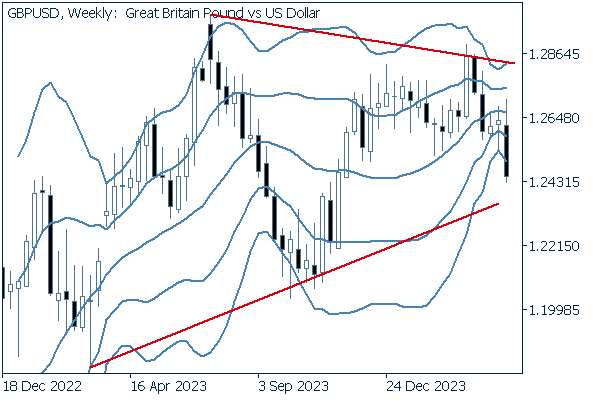

The weekly chart shows the pair remaining inside a triangle formation. The pair's current momentum, if it leads to a breakthrough below the triangle floor, could be the start of a longer-term bear market.
Was this article helpful?
0 out of 0 people found this article helpful.
Thank you for your feedback.
FXON uses cookies to enhance the functionality of the website and your experience on it. This website may also use cookies from third parties (advertisers, log analyzers, etc.) for the purpose of tracking your activities. Cookie Policy
