


2024.04.08
This article was :
published
updated
Weekly FX Market Review and Key Points for the Week Ahead
Currency markets last week saw the dollar weaken, followed by a weakening yen.
In the first half of the week, the dollar was testing the yen just below a USDJPY level of 152, its highest point since 2000. Though the pair reached a high of 151.95 on Wednesday, April 3, it once again failed to break above 152.
Then, the pair fell sharply from Thursday into Friday (4th/5th), but recovered to a degree later on Friday due to a strong jobs data report from the United States.
The EURUSD and GBPUSD pairs also bottomed out from Monday into Tuesday (1st/2nd), and then began to rise as the dollar weakened.
Let's take a look back at the week's developments as we assess how economic events shaped each currency pair's maneuvers.
On Monday, April 1, Japan's quarterly BOJ Tankan report for January to March delivered results exceeding expectations, coming in at 11 versus a forecast of 10.
The same day, the U.S. released its March ISM Manufacturing PMI, with a result of 50.3, beating both the forecast of 48.4 and the previous reading of 47.8.
On Wednesday, April 3, preliminary and year-on-year data for the Eurozone's March Harmonised Index of Consumer Prices were released. Overall figures rose 2.4% versus a 2.6% forecast, with the core index up 2.9% versus a 3.0% forecast.
On the same day, month-on-month data were released for the March ADP National Employment Report, with a favorable result of 184,000 jobs added versus the expected 148,000. Also, the U.S. March ISM Non-Manufacturing PMI (composite) showed a reading of 51.4 versus a forecast of 52.7, falling below expectations.
Then, on Friday, April 5, the much-awaited U.S. jobs report was released.
It revealed that month on month, nonfarm payrolls jumped by 303,000 jobs vs. 200,000 expected in March.In March, unemployment was 3.8% versus a forecast of 3.9%.
Month on month, average hourly earnings in March rose 0.3%, matching the forecast of 0.3%.Year on year, these same average hourly earnings showed a 4.1% increase, also matching the forecast of 4.1%.
Overall, the jobs report exceeded expectations, leading to a rise in the USDJPY and a fall in the EURUSD and GBPUSD pairs.
Economic Indicators and Statements to Watch this Week
(All times are in GMT)
April 10 (Wed)
12:30, U.S.: March Consumer Price Index (CPI, month on month data)
12:30, U.S.: March Consumer Price Index (CPI, year on year data)
12:30, U.S.: March Consumer Price Index (CPI core index, month on month data)
12:30, U.S.: March Consumer Price Index (CPI core index, year on year data)
18:00, U.S.: Federal Reserve Open Market Committee (FOMC) meeting agenda
April 11 (Thu)
12:15, Europe: European Central Bank (ECB) Governing Council policy interest rate announcement
12:45, Europe: Regular press conference by European Central Bank (ECB) President Christine Lagarde
April 12 (Fri)
06:00, U.K.: February monthly gross domestic product (GDP, month-on-month data)
This week's highlight is the U.S. CPI release on Wednesday. Although more than a majority of polled economists currently expect rate cuts to begin in June, CPI results could suggest persistent inflation, resulting in delayed timing.
This Week's Forecast
The following currency pair charts are analyzed using an overlay of the ±1 and ±2 standard deviation Bollinger Bands, with a period of 20 days.
USDJPY
The focus is likely to be on whether or not the pair will break above 152; this is expected to be a fierce battleground due to profound attention from many market participants. Based on the Japan-U.S. interest rate differential, pressure to buy the dollar and sell the yen is alive and well, but the possibility of currency intervention by the BOJ around this price range makes the situation unpredictable.
Last week, the pair dropped sharply from Thursday into Friday, temporarily falling below 151 to 150.81. However, the positive U.S. jobs report helped the pair return to above 151.5.
Next is an analysis of the USDJPY daily chart.
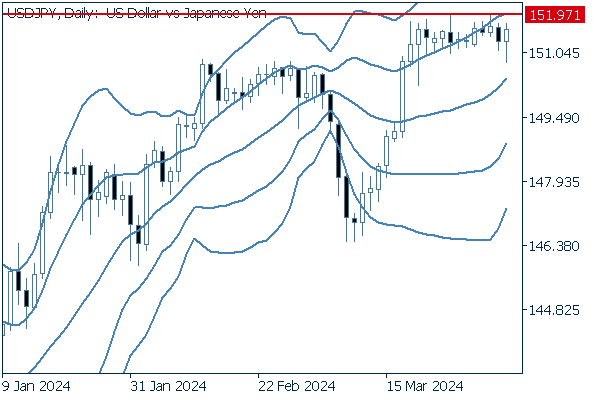
It is clear that trades are dancing tightly around a line just below 152, with the price continuing to straddle the +1 standard deviation Bollinger Band. The Bollinger Bands' middle line is rising steadily, suggesting strong upward pressure over this time period.
We continue with an analysis of the USDJPY weekly chart.
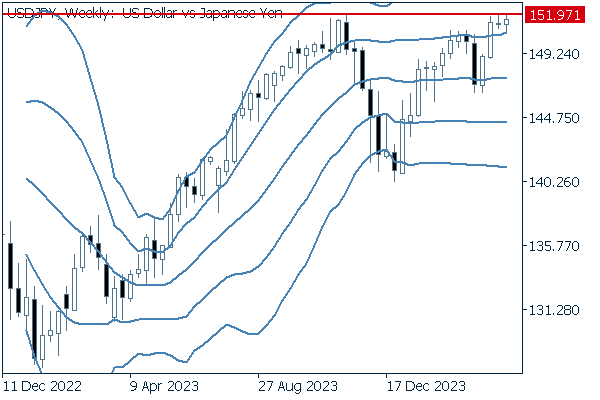
The chart shows that the pair has been firmly entrenched in a price range just before 152. A higher high here would suggest, per Dow Theory, an ongoing uptrend.
EURUSD
On Thursday, April 11, the European Central Bank (ECB) is scheduled to announce its policy interest rate and ECB President Lagarde is scheduled to hold a press conference. Market expectations are for the interest rate to remain unchanged, but traders will be looking for any further prospects in the accompanying commentary and other information.
Next is an analysis of the EURUSD daily chart.
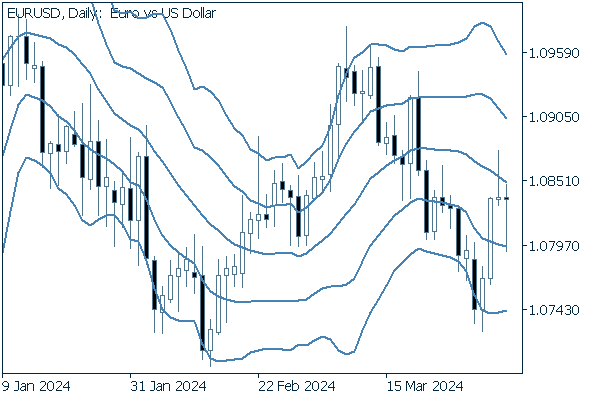
Though the pair rebounded at the -2 standard deviation Bollinger Band and passed the middle line, it failed to stay above the line at the most recent close. Without any fresh highs or lows, the pair reveals no clear directional trend.
We continue with an analysis of the EURUSD weekly chart.
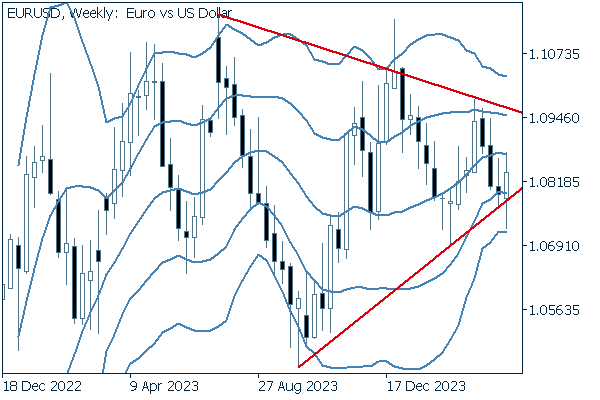
Even on a weekly basis, the triangle formation of lower highs and higher lows brings no clarity in price trends.
GBPUSD
On April 12, the U.K. will release its month-on-month GDP data for February. With January's data showing 0.2% growth versus a 0.1% forecast, the results will be closely watched.
Now, we analyze the daily GBPUSD chart.
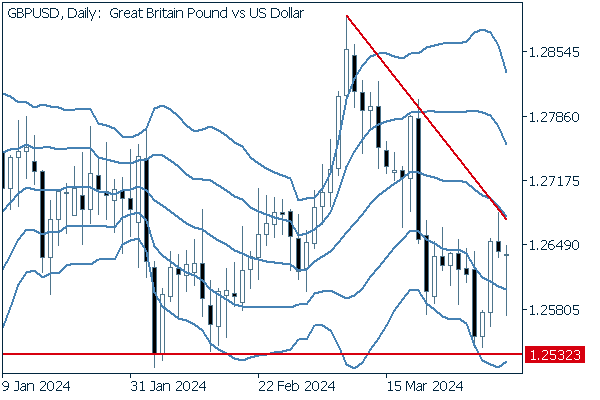
With a floor at 1.2532 and falling highs, it is reasonable to conclude that the market will enter an adjustment phase. Traders will be looking to see which line will be broken: support or resistance.
We continue with an analysis of the GBPUSD weekly chart.
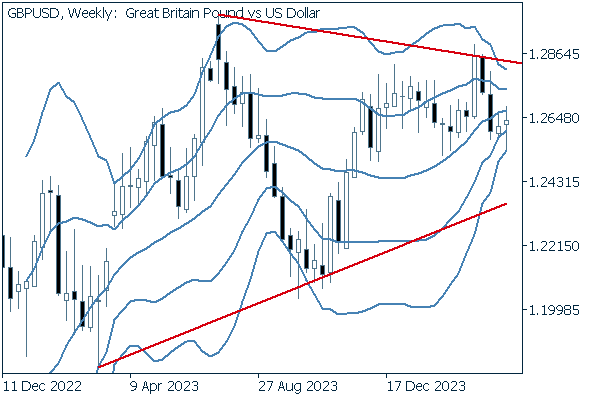
The weekly trend also appears to show a triangle formation. The rapidly-contracting Bollinger Band width suggests no momentum in either direction for near-term price action.
Was this article helpful?
0 out of 0 people found this article helpful.
Thank you for your feedback.
Send