2024.03.25
This article was :
published
updated
Weekly FX Market Review and Key Points for the Week Ahead
Last week saw a series of important economic indicator releases and key figures' statements, including policy rate announcements in Japan and the United States. This analysis summarizes the past week's market developments to provide suggestions for deciphering market movements in the coming week and beyond.
On Monday, March 18, the Eurozone's February Harmonised Index of Consumer Prices was released, aligning with market expectations. Shortly after this announcement, the EURUSD reached a high of 1.0906 before retreating to a low of 1.0866.
On Tuesday, March 19, the Bank of Japan made a policy rate announcement after its monetary policy meeting, which as widely expected terminated the negative interest rate policy after 17 years, as well as yield curve control activities and ETF purchases. These measures had been gradually disclosed in news reports over the preceding weeks, suggesting that the market had almost entirely priced in these developments.
Shortly after noon (3:00/GMT) following this announcement, the USDJPY entered a resurgent uptrend, once again surpassing the 150 level. The pair continued to rise without significant retracing, reaching a high of 150.96.
On Wednesday, March 20 at 18:00 (GMT), the highly anticipated FOMC policy interest rate announcement was made, maintaining rates at 5.25-5.50%, as predicted by the market.
While some speculated a decrease to two rate cuts by the end of 2024, the consensus remained at three cuts. This was closely divided among the 19 members, with nine predicting two cuts or fewer.
At the following press conference, however, Federal Reserve Chairman Jerome Powell reiterated that it would be appropriate to begin easing at some point this year. He also approved of slowing balance sheet runoff reduction fairly soon, which in combination led to a reversal in the declining dollar trend.
On Thursday, March 21, the Bank of England's (BOE) policy interest rate announcement also met expectations, holding steady at 5.25%. Notably, two members shifted their votes from advocating rate hikes to maintaining the current rate, fueling market expectations for potential rate cuts.
Economic Indicators and Statements to Watch this Week
(All times are in GMT)
March 25 (Mon)
23:50 (Sunday night), Japan: Bank of Japan monetary policy meeting agenda
14:00, Japan: February new home sales (annualized)
14:00, U.S.: February new home sales (month on month)
March 28 (Thu)
07:00, U.K.: October-December quarterly gross domestic product (revised GDP, quarter-on-quarter data)
07:00, U.K.: October-December quarterly gross domestic product (revised GDP, year-on-year data)
12:30, U.S.: October-December quarterly real gross domestic product (finalized GDP, quarter-on-quarter annualized data)
March 29 (Fri)
12:30, U.S.: February personal consumption expenditures (PCE deflator, year-on-year data)
12:30, U.S.: February personal consumption expenditures (core PCE deflator, excluding food and energy, month-on-month data)
12:30, U.S.: February personal consumption expenditures (core PCE deflator, excluding food and energy, year-on-year data)
This week's highlight is the personal consumption expenditures (PCE) data release on the 29th, a key inflation measure for the U.S. that could influence the timing and number of rate cuts.
This Week's Forecast
The following currency pair charts are analyzed using an overlay of the ±1 and ±2 standard deviation Bollinger Bands, with a period of 20 days.
USDJPY
Having navigated last week's policy interest rate announcements both the dollar and yen, the USDJPY has returned to the 150 range. For the moment, the market anticipates the first Fed interest rate cut to take place in June.
Meanwhile, there is no clarity regarding specific timings for Japan to raise interest rates, suggesting the continuation of a USDJPY uptrend based on the significant interest rate differential between Japan and the U.S.
Next is an analysis of the USDJPY daily chart.
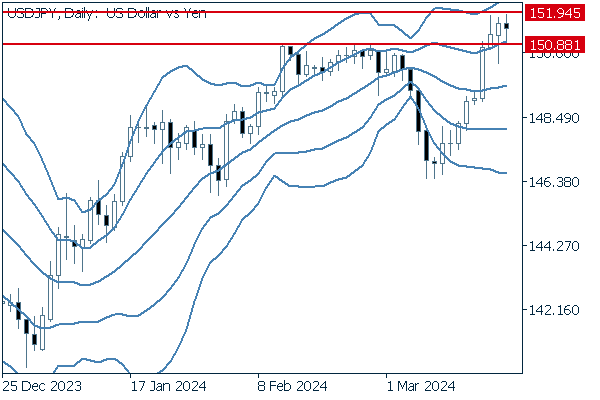
Analysis reveals a close approach to the year-to-date high of 150.88 on Tuesday, with a subsequent break beyond said high Wednesday. The pair maintained higher closing prices on Thursday and Friday, potentially setting the stage to test the 2022 high of 151.94.
We continue with an analysis of the USDJPY weekly chart.
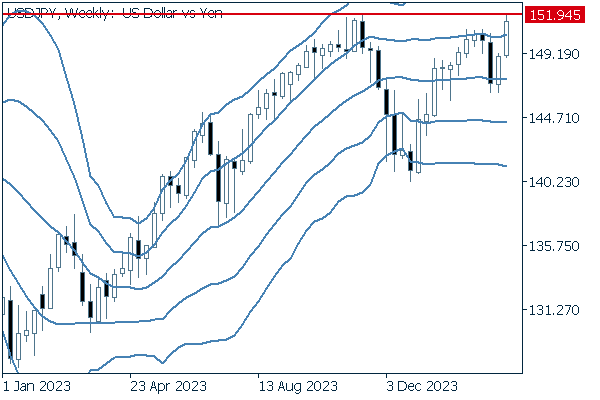
The chart shows the pair coming very close to the 2022 high, which proved impenetrable in 2023. If the price breaks above this point, it will be difficult to determine support or resistance lines, as this range has not been reached since the year 2000.
EURUSD
No high-profile economic indicator announcements related to the euro are scheduled this week. Following the FOMC meeting, a reconfirmed uptrend in the dollar suggests a downtrend for the EURUSD.
Next is an analysis of the EURUSD daily chart.
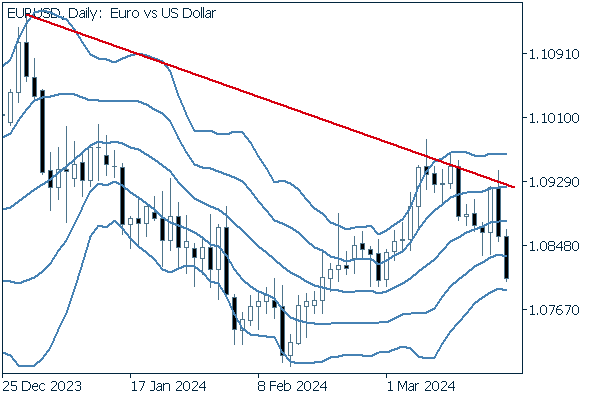
Analysis shows a decline following a trend line drawn from December's high of 1.1139. A series of long bearish candles have breached the Bollinger Bands' middle line.
We continue with an analysis of the EURUSD weekly chart.
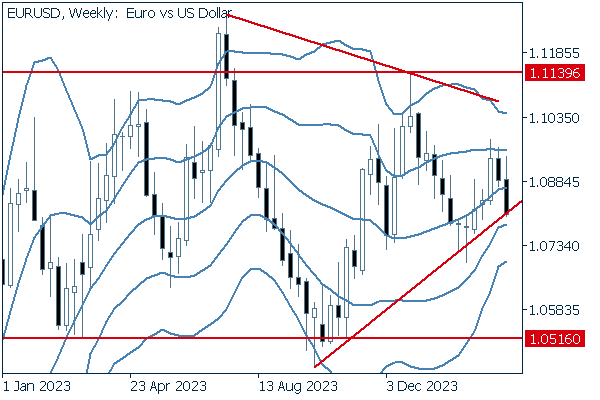
The pair is broadly contained within a range of about 600 pips, and finds itself in a triangle formation with descending highs and rising lows. Recently, the pair has moved toward the lower edge of the triangle, attracting attention as to whether it will break below.
GBPUSD
Pound-related news includes the revised quarterly GDP to be released on the 28th. Forecasts mirror previous estimates of -0.3% (quarter on quarter) and -0.2% (year on year).
Now, we analyze the daily GBPUSD chart.
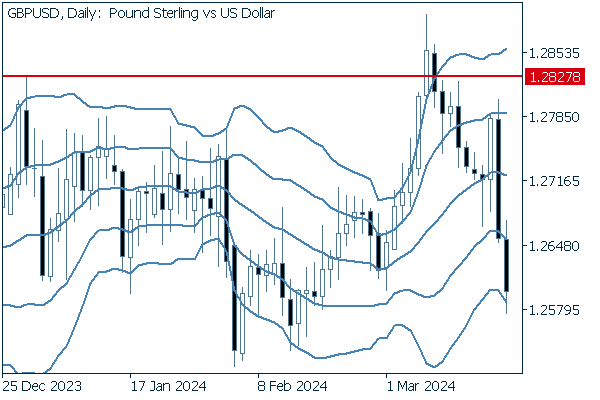
Analysis shows a false breakout above the recent high of 1.2827. Similar to the EURUSD, markets are showing strong buying momentum for the dollar with successive long bearish candles.
We continue with an analysis of the GBPUSD weekly chart.
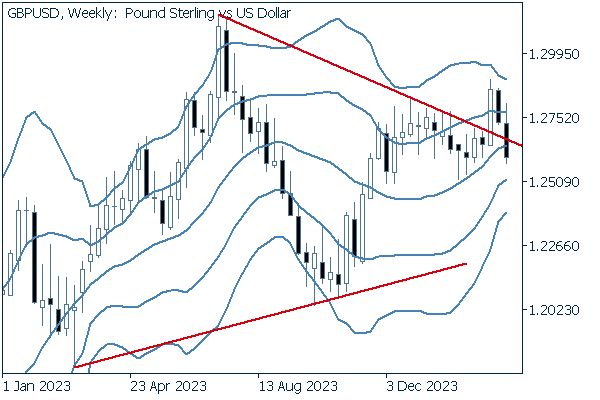
The pair exhibited a false breakout above a triangle formation, leading to the natural conclusion that the long-term price direction has not yet emerged.
Was this article helpful?
0 out of 0 people found this article helpful.
Thank you for your feedback.
Send