


2024.03.18
This article was :
published
updated
Weekly FX Market Review and Key Points for the Week Ahead
Through the past week, the USDJPY rose while the EURUSD and GBPUSD moved to correct upward momentum. The USDJPY traded in the range of 146.48 to 149.16, with a break above 150 once again in sight.
There has been a sudden and new flood of media coverage about the Bank of Japan reversing from its negative interest rate policy, and some reports suggest this may be timed to coincide with the central bank's monetary policy meeting, to take place on March 18 and 19. However, since the USD continued to rise even after this news broke, it is highly likely that markets had already factored in a policy reversal by last week.
On March 11, the Japanese government released the country's quarterly real gross domestic product (revised values) for October to December. Year on year, quarterly real GDP rose 0.1% versus a forecast of 0.3%, while the annualized increase was 0.4% versus a forecast of 1.1%.
On March 12, much-awaited U.S. Consumer Price Index (CPI) data was released. The core index rose 0.4% month on month versus a 0.3% forecast, and was up 3.8% year on year versus a 3.7% forecast. Overall, the CPI data was generally in line with expectations, with only transitory fluctuation.
On March 13, the U.K. released its month-on-month GDP data for January. Data showed a 0.2% increase, matching a forecast of 0.2%.
On March 14, data was released for U.S. retail sales and the wholesale pricing index (Producer Price Index, or PPI). Month-on-month, retail sales rose 0.6% versus a forecast of 0.8%. When excluding the automotive sector, retail sales rose 0.3% month on month versus a 0.5% forecast.
The PPI rose 0.6% month on month versus a 0.3% forecast, and was up 1.6% year on year versus a 1.1% forecast. The PPI core index rose 0.3% month on month versus a 0.2% forecast, and was up 2.0% year on year versus a 1.9% forecast.
・ Economic Releases and Statements to Watch this Week
(All times are in GMT)
March 18 (Mon)
10:00 Europe: February Harmonised Index of Consumer Prices (revised HICP, year on year data)
10:00 Europe: February Harmonised Index of Consumer Prices (revised HICP core index, year on year data)
March 19 (Tue)
TBD (Japan) Bank of Japan monetary policy meeting, post-meeting policy rate announcement
06:30 (Japan) Regular press conference by Bank of Japan Governor Kazuo Ueda
18:00 (U.S.) Federal Reserve Open Market Committee (FOMC) meeting, post-meeting policy rate announcement
18:30 (U.S.) Regular press conference by Federal Reserve Chairman Jerome Powell
March 21 (Wed)
12:00 (U.K.) Bank of England (BOE, U.K. central bank) interest rate announcement
12:00 (U.K.) Bank of England Monetary Policy Committee (MPC) meeting
23:30 (Japan) February Consumer Price Index, Japan (CPI, all items, year on year data)
23:30 (Japan) February Consumer Price Index, Japan (CPI, all items less fresh food, year on year data)
23:30 (Japan) February Consumer Price Index, Japan (CPI, all items less fresh food and energy, year on year data)
While the reversal from negative interest rates in Japan is seen as a strong possibility, the market has incorporated a near-zero chance that U.S. rates will change, given the 98% probability that the FOMC will leave rates unchanged at its closest upcoming meeting on Wednesday the 20th according to the CME FedWatch tool.
This Week's Forecast
The following currency pair charts are analyzed using an overlay of the ±1 and ±2 standard deviation Bollinger Bands, with a period of 20 days.
USDJPY
If the reversal of Japan's negative interest rate policy, i.e. an interest rate hike, is priced into the market, there would be little grounds to buy JPY. Conversely, since there is a strong expectation that there will be no USD interest rate cuts for some time, a case can be made for the USDJPY to re-enter a buying phase.
Traders may need to position themselves to incorporate a third attempt at a record high. Next is an analysis of the USDJPY daily chart.
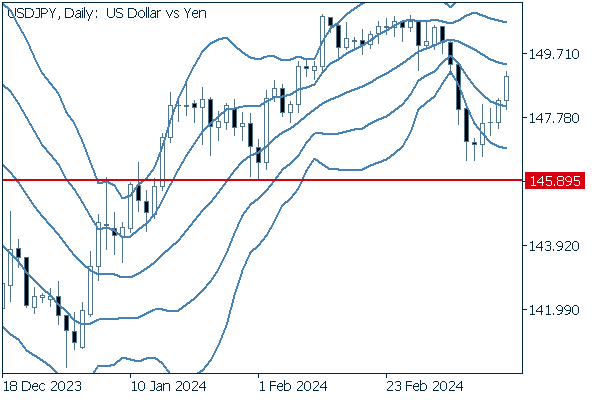
Daily values suggest remaining upward momentum in the USDJPY due to the upward reversal beginning before touching the low of 145.89, the starting point from which the currency pair reached the year-to-date high for 2024.
The most recent candlestick above the -1 standard deviation Bollinger Band can also be interpreted as a sign selling momentum has weakened. Traders should be prepared for movement attempting to break above 150.
We continue with an analysis of the USDJPY weekly chart.
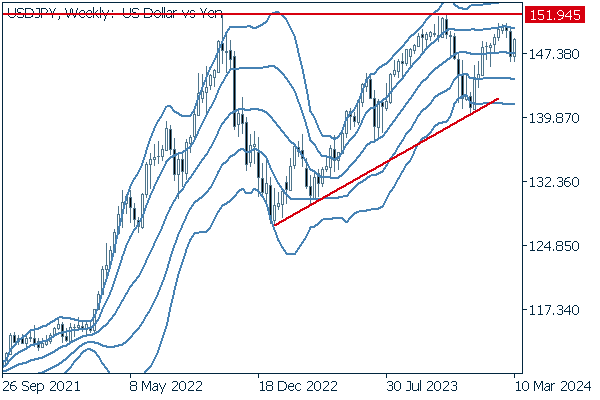
The weekly chart shows new support levels building above previous lows, and it would not be surprising to see the pair test highs one more time.
Looking at the Bollinger Bands, the pair rebounded after touching the middle line.
EURUSD
At 10:00 GMT today, Europe will release revised data for its consumer price index, the Harmonised Index of Consumer Prices. The forecast for the year-on-year change remains the same as for the previous release.
Next is an analysis of the EURUSD daily chart.
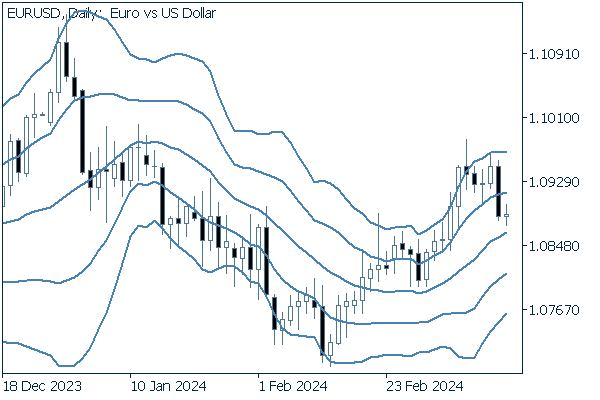
The EURUSD is in corrective retreat after reaching the +2 standard deviation Bollinger Band. The closing price falling below the +1 standard deviation band suggests a slowdown in upward momentum, presenting the possibility of a drop of some degree just ahead.
We continue with an analysis of the EURUSD weekly chart.
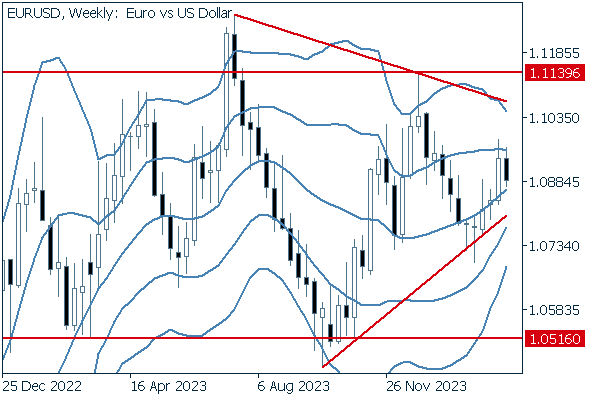
Though the pair continues to trade in a single range, the chart has created a triangle formation with descending support levels and rising resistance levels. This creates a situation of great interest, as it offers a breakout in either direction.
GBPUSD
This week, the Bank of England is to make a policy rate announcement on Thursday the 21st. Forecasts suggest an unchanged rate at 5.25%, with a low likelihood of a surprise. Now, we analyze the daily GBPUSD chart.
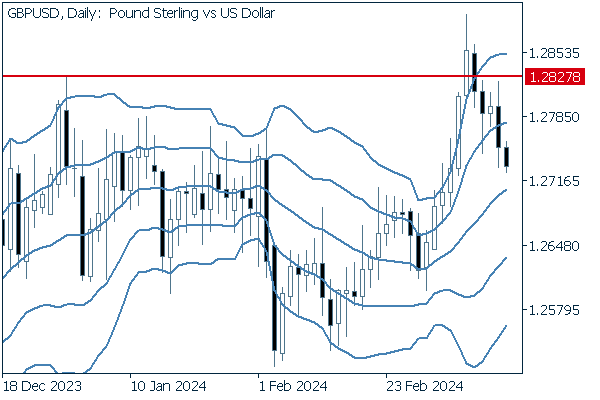
Despite exceeding recent highs, the GBPUSD retreated to trade inside the existing bands in a false breakout. The pair falling below the +1 standard deviation Bollinger Band suggests that upward momentum has been at least temporarily reset.
We continue with an analysis of the GBPUSD weekly chart.
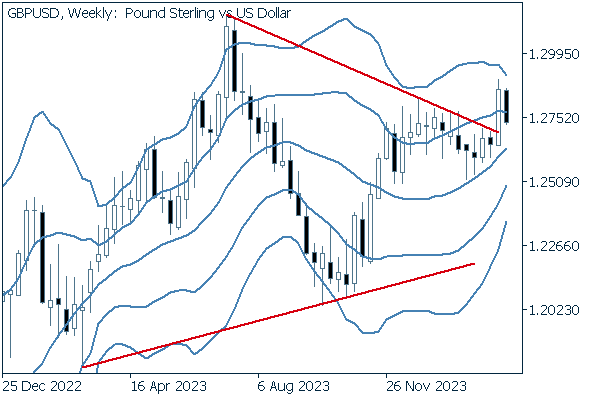
Looking at the weekly trend, though the pair has broken above the upper line of a triangle formation and returned to said upper line, it remains above the triangle. It would not be unreasonable to assume a case where the old line becomes a support.
Was this article helpful?
28 out of 29 people found this article helpful.
Thank you for your feedback.
Send