


2024.09.17
This article was :
published
updated
Recap of previous trading day (September 16)
Yesterday the USDJPY continued its downward trend from around GMT 00:00, hitting a low of 139.57 yen shortly after GMT 07:00, marking a new low for the year.
The New York Empire State Manufacturing Index for September that was announced at GMT 12:30 came in at +11.5 compared to forecasts of -0.4, and the USDJPY rose in response to this bullish figure. Not long after GMT 15:30 the market hit a high of 140.91, and trading for the day closed at 140.60.
Recap of the Tokyo market and outlook going forward
Today, the USDJPY hit a high of 141.24 between GMT 23:00 and GMT 00:00, then fell back to mark a low of 140.31 a little while after GMT 02:00.
Looking at the 1-hour chart of the USDJPY (as of GMT 03:10 on September 17), the price has broken completely through the previous support line of 141.68 and is now trading right above the critical 140-yen level.
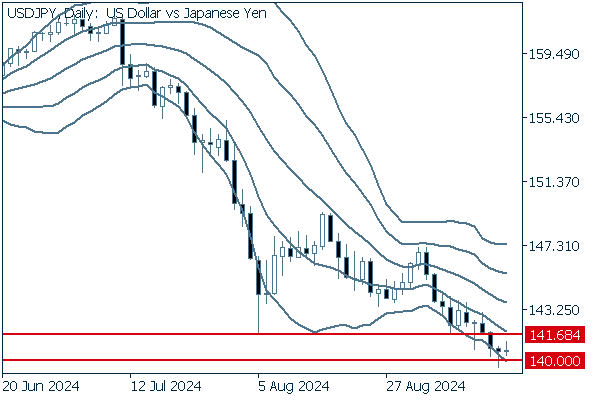
(20-period Bollinger Band, showing ±1 and ±2 standard deviations)
Today's main economic indicators are as follows.
- GMT 12:30 U.S. August Retail sales (MoM)
- GMT 12:30 U.S. August Retail sales excluding autos (MoM)
- GMT 13:15 U.S. August Industrial production (MoM)
- GMT 14:00 U.S. September NAHB Housing Market Index
Was this article helpful?
0 out of 0 people found this article helpful.
Thank you for your feedback.
Send