


2024.09.18
This article was :
published
updated
Recap of previous trading day (September 17)
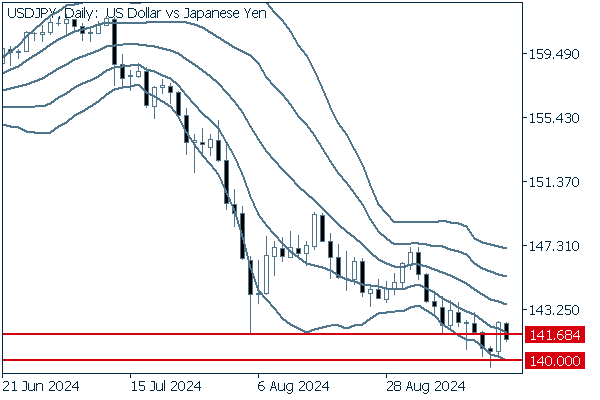
Yesterday the USDJPY reached 141.24 shortly before GMT 22:00, from which peak it sold off and then traded in a range, with the price moving in the 140-yen zone during the New York session.
The U.S. retail sales for August that were announced at GMT 12:30 were good, coming in at +0.1% month on month, versus forecasts of -0.2%, and the market reacted by buying the dollar.
Recap of the Tokyo market and outlook going forward
Today the USDJPY opened at 142.33, then declined continuously so that by GMT 05:30 it was trading in the middle of the 141-yen range.
Looking at the 1-hour chart of the USDJPY (as of GMT 05:30 on September 18), the previous close on the daily chart broke above the -1 standard deviation of the Bollinger Band, but is sinking below that line once again.
With regard to the FOMC, a 0.5% cut to interest rates is seen as most likely.
(20-period Bollinger Band, showing ±1 and ±2 standard deviations)
Today's main economic indicators are as follows.
- GMT 12:30 U.S. August Housing starts
- GMT 12:30 U.S. August Building permits
- GMT 18:00 Announcement on interest rates after U.S. Federal Open Market Committee (FOMC) meeting
- GMT 18:30 U.S. Regular press conference with FRB Chairman Jerome Powell
Was this article helpful?
0 out of 0 people found this article helpful.
Thank you for your feedback.
Send