


2024.07.16
This article was :
published
updated
Recap of previous trading day (July 15)
Yesterday (Monday) the USDJPY gapped up at the open, and shortly after GMT 23:00 (i.e. on Sunday in the GMT time zone) it hit a high of 158.42. It subsequently fell to close the initial gap. Some time after GMT 16:00 on July 15, the market reached a low of 157.15.
It was a day on which the aftermath of the plunge in the price that followed last Thursday's intervention by the Japanese currency authorities was still being felt.
Recap of the Tokyo market and outlook going forward
After marking a low shortly before GMT 16:00 the USDJPY rebounded, and that upward trend continued in today's Tokyo session.
Looking at the 1-hour chart of the USDJPY (as GMT 05:00 on July 16), the Bollinger Bands have expanded and the price is trading in the area of the +2 standard deviation. Volatility is on a rising trend and it appears as if there is some upward momentum to the market.
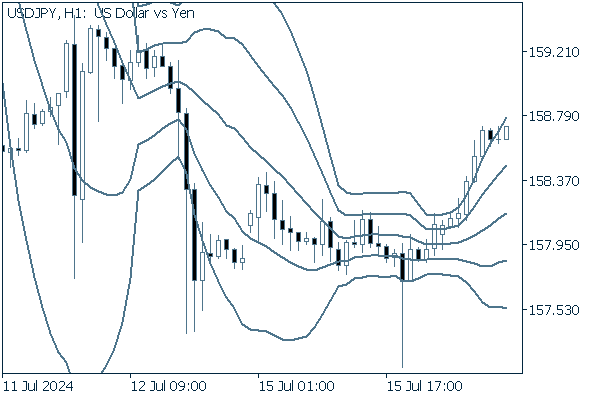
(20-period Bollinger Band, showing ±1 and ±2 standard deviations)
Today's main economic indicators are as follows.
- GMT 12:30 U.S. June Retail sales (MoM)
- GMT 12:30 U.S. June Retail sales excluding autos (MoM)
Was this article helpful?
0 out of 0 people found this article helpful.
Thank you for your feedback.
Send