


2024.07.17
This article was :
published
updated
Recap of previous trading day (July 16)
Yesterday the USDJPY traded in the 158-yen range, setting a high of 158.85 just before GMT 13:00. Thereafter the price came off to close at 158.33, without any clear sense of direction.
Recap of the Tokyo market and outlook going forward
Today the USDJPY traded in a tight range-bound market in the morning, within the extents of the previous day's movement, and was hovering around 158.40 at noon.
Looking at the 1-hour chart of the USDJPY (as of GMT 03:00 on July 17), it appears to still be in a lull after the significant price decline of last week. The width of the Bollinger Bands and the slope of the middle line give little sense of momentum.
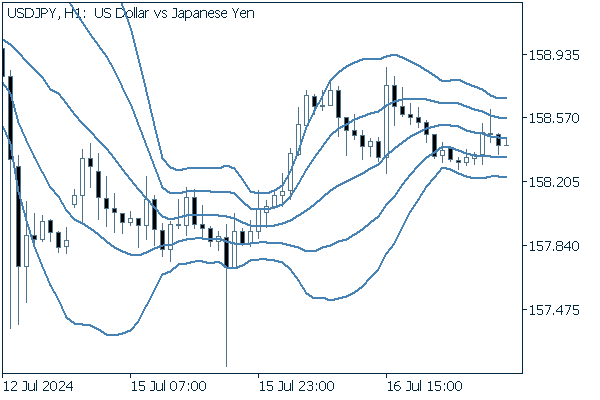
(20-period Bollinger Band, showing ±1 and ±2 standard deviations)
Today's main economic indicators are as follows.
- GMT 12:30 U.S. June Housing starts (seasonally adjusted annual rate)
- GMT 12:30 U.S. June Housing starts (MoM)
- GMT 12:30 U.S. June Building permits (seasonally adjusted annual rate)
- GMT 12:30 U.S. June Building permits (MoM)
- GMT 13:15 U.S. June Industrial production (MoM)
- GMT 18:00 U.S. Regional FRB economic reports (Beige Book)
Was this article helpful?
0 out of 0 people found this article helpful.
Thank you for your feedback.
Send