2024.07.15
This article was :
published
updated
Recap of previous trading day (July 12)
On Friday of last week, in the aftermath of the plunge in the market that followed Thursday's Consumer Price Index (CPI), the USDJPY was in a state of high volatility with repeated fluctuations in the price. There were passages of violent up-and-down movement between GMT 23:00 and GMT 00:00 and again after GMT 12:00.
Ultimately trading for the week ended at 157.86 yen.
Recap of the Tokyo market and outlook going forward
Due in part to the Tokyo market being on holiday today, trading in the USDJPY lacked direction despite.
Looking at the 1-hour chart of the USDJPY (as of GMT 04:10 on July 15), the contraction in the Bollinger Band shows that the volatility that had risen as a result of the wild price movements of the previous week has to some extent fallen.
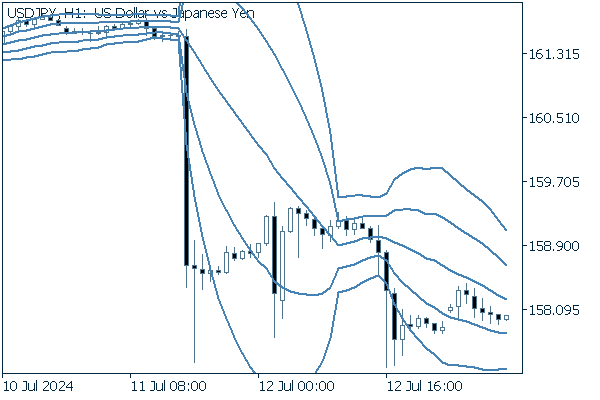
(20-period Bollinger Band, showing ±1 and ±2 standard deviations)
Today's main economic indicators are as follows.
- GMT 12:30 U.S. July New York Empire State Manufacturing Index
- GMT 16:30 U.S. Statements from FRB Chairman Jerome Powell
Was this article helpful?
0 out of 0 people found this article helpful.
Thank you for your feedback.
Send