2024.06.24
- Features
-
Services/ProductsServices/ProductsServices/Products

Learn more about the retail trading conditions, platforms, and products available for trading that FXON offers as a currency broker.
You can't start without it.
Trading Platforms Trading Platforms Trading Platforms
Features and functionality comparison of MetaTrader 4/5, and correspondence table of each function by OS
Two account types to choose
Trading Account Types Trading Account Types Trading Account Types
Introducing FXON's Standard and Elite accounts.
close close

-
SupportSupportSupport

Support information for customers, including how to open an account, how to use the trading tools, and a collection of QAs from the help desk.
Recommended for beginner!
Account Opening Account Opening Account Opening
Detailed explanation of everything from how to open a real account to the deposit process.
MetaTrader4/5 User Guide MetaTrader4/5 User Guide MetaTrader4/5 User Guide
The most detailed explanation of how to install and operate MetaTrader anywhere.
FAQ FAQ FAQ
Do you have a question? All the answers are here.
Coming Soon
Glossary Glossary GlossaryGlossary of terms related to trading and investing in general, including FX, virtual currencies and CFDs.
News News News
Company and License Company and License Company and License
Sitemap Sitemap Sitemap
Contact Us Contact Us Contact Us
General, personal information and privacy inquiries.
close close

- Promotion
- Trader's Market
- Partner
-
close close
Learn more about the retail trading conditions, platforms, and products available for trading that FXON offers as a currency broker.
You can't start without it.
Features and functionality comparison of MetaTrader 4/5, and correspondence table of each function by OS
Two account types to choose
Introducing FXON's Standard and Elite accounts.
Support information for customers, including how to open an account, how to use the trading tools, and a collection of QAs from the help desk.
Recommended for beginner!
Detailed explanation of everything from how to open a real account to the deposit process.
The most detailed explanation of how to install and operate MetaTrader anywhere.
Do you have a question? All the answers are here.
Coming Soon
Glossary of terms related to trading and investing in general, including FX, virtual currencies and CFDs.
General, personal information and privacy inquiries.
Useful information for trading and market information is posted here. You can also view trader-to-trader trading performance portfolios.
Find a trading buddy!
Share trading results among traders. Share operational results and trading methods.
- Legal Documents TOP
- Client Agreement
- Risk Disclosure and Warning Notice
- Order and Execution Policy
- Complaints Procedure Policy
- AML/CFT and KYC Policy
- Privacy Policy
- eKYC Usage Policy
- Cookies Policy
- Website Access and Usage Policy
- Introducer Agreement
- Business Partner Agreement
- VPS Service Terms and Condition

This article was :
published
updated
Recap of previous trading day (June 21)
On Friday of last week the USDJPY trended upward throughout the day. Particularly after GMT 13:45, when multiple economic indicators were announced in the U.S., the price rose significantly, temporarily hitting 159.62.
Before the close it had another surge, reaching a high of 159.83 before trading ended for the week.
Recap of the Tokyo market and outlook going forward
Today the USDJPY began rising in the morning session, hitting a high of 159.92 before entering a moderate decline.
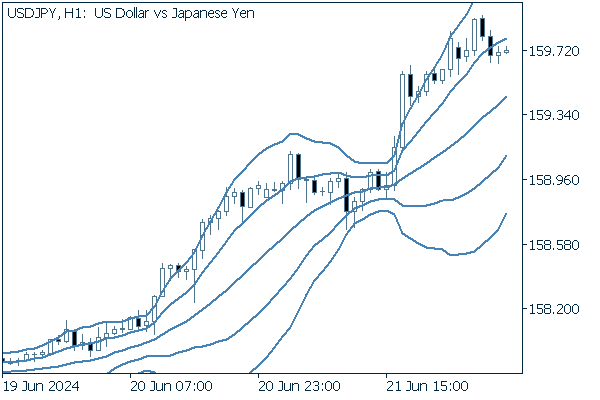
Looking at the 1-hour chart of the USDJPY (as of GMT 03:20 on June 24), the Bollinger Bands are visibly widening during the walk along the upper band, and contracting when the price stalls.


(20-period Bollinger Band, showing ±1 and ±2 standard deviations)
No closely watched economic indicators or comments by influential individuals are scheduled for today.
With no significant economic events expected, if the current trend is maintained then there could be an attempt to break through 160 yen.
Was this article helpful?
0 out of 0 people found this article helpful.
Thank you for your feedback.
FXON uses cookies to enhance the functionality of the website and your experience on it. This website may also use cookies from third parties (advertisers, log analyzers, etc.) for the purpose of tracking your activities. Cookie Policy
