


2024.06.25
This article was :
published
updated
Recap of previous trading day (June 24)
Yesterday the USDJPY trended downward after hitting a high of 159.92 during Tokyo trading hours, then fell sharply at around GMT 10:00 to hit a low of 158.74 yen. However, after making a long wick at the bottom of the candle body the price rebounded straight away and recovered nearly all of its sudden decline.
Recap of the Tokyo market and outlook going forward
Today was a so-called "5/10 day" (a date ending in "5" or on a multiple of "10" on which Japanese companies often settle foreign exchange payments), but the USDJPY began to fall in the morning session, marking a low of 159.18 just after GMT 01:00.
Looking at the 1-hour chart of the USDJPY (as of GMT 03:55 as of June 25), the middle line of the Bollinger Bands has shifted to a downward trend, with the price below that again. It rather seems as if the market has switched to a bearish stance in the short term.
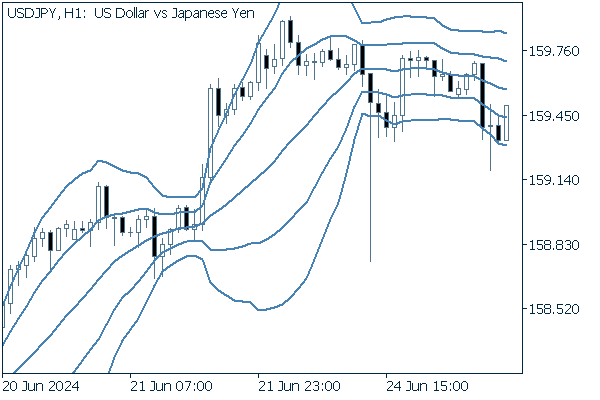
(20-period Bollinger Band, showing ±1 and ±2 standard deviations)
Today's main economic indicators are as follows.
- GMT 13:00 U.S. April Case-Shiller home price index (YoY)
- GMT 14:00 U.S. June Consumer Confidence Index (Conference Board)
- GMT 14:00 U.S. June Richmond Fed manufacturing index
Was this article helpful?
0 out of 0 people found this article helpful.
Thank you for your feedback.
Send