


2024.06.21
This article was :
published
updated
Recap of previous trading day (June 20)
Yesterday the USDJPY trended upward all day. After opening at 158.06, it continued to rise at a steady pace, so that just before the close it hit a high of 158.94 yen.
Initial jobless claims for the previous week that were announced yesterday came in at 238,000 close to the expected figure of 235,000. It had no significant effect on price movement.
Recap of the Tokyo market and outlook going forward
Today the USDJPY reached a high of 159.12 just before GMT 01:00, but then sold off.
Looking at the 1-hour chart of the USDJPY (as of GMT 05:30 on June 21), the band walk between the +1 and +2 standard deviation Bollinger Bands has ended and the price appears to be in a pullback.
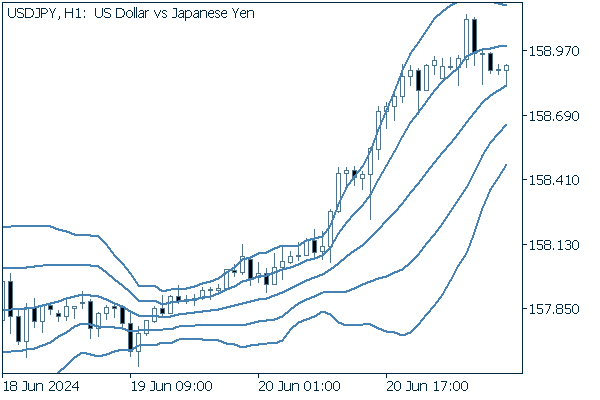
(20-period Bollinger Band, showing ±1 and ±2 standard deviations)
Today's main economic indicators are as follows.
- GMT 13:45 U.S. June Manufacturing Purchasing Managers Index (PMI, preliminary)
- GMT 13:45 U.S. June Services Purchasing Managers Index (PMI, preliminary)
- GMT 13:45 U.S. June Composite Purchasing Managers Index (PMI, preliminary)
- GMT 14:00 U.S. May Leading Index (MoM)
- GMT 14:00 U.S. May Existing home sales (seasonally adjusted annual rate)
- GMT 14:00 U.S. May Existing home sales (MoM)
Was this article helpful?
0 out of 0 people found this article helpful.
Thank you for your feedback.
Send