


2025.12.29
This article was :
published
updated
Weekly FX Market Review and Key Points for the Week Ahead
In the foreign exchange market for the week that ended on December 28th, the sell-off of the yen, which originated from the Monetary Policy Meeting of the Bank of Japan (BOJ) late in the previous week, has halted. However, the market struggled to find direction as a limited number of traders participated due to the Christmas holidays. The USDJPY fell to the mid-155 yen range during the week but later rebounded to the upper 156 yen range to conclude the weekly trading session. The EURUSD rose to the 1.18 range, but the GBPUSD remained unchanged after reaching the 1.35 range.
December 22 (Mon)
Late in the previous week, the USDJPY rose to the upper 157 yen range following the BOJ meeting. However, on this day, Financial Minister Satsuki Katayama warned against a weak yen. It prompted traders to buy yen, leading the pair to fall back to the 156.8 yen range.
As the dollar weakened against the yen, the EURUSD soared to the upper 1.17 range and the GBPUSD climbed to the upper 1.34 range.
December 23 (Tue)
The impact of Katayama's warning lingered as the yen continued to strengthen against the dollar. Early in the day, the USDJPY fell to 155.65 yen. However, stronger-than-expected U.S. economic figures lifted the pair to the mid-156 yen range.
Meanwhile, the EURUSD reached the 1.18 range before being pushed down. The GBPUSD followed suit, reaching the 1.351 range before declining.
December 24 (Wed)
While the market turned quiet ahead of Christmas, the yen continued to strengthen against the dollar, pushing the USDJPY down to the 155.5 yen range. There, the pair halted its downtrend and later hovered within the upper 155 yen range.
Meanwhile, the EURUSD rose and returned to the 1.18 range. However, during New York trading hours, the pair fell to the 1.178 range. The GBPUSD struggled to climb and temporarily fell below the 1.35 level.
December 25 (Thu)
Most financial markets were closed for Christmas. Consequently, the foreign exchange market was virtually inactive with low trading volume. Although the USDJPY temporarily reached the 155.6 yen range, all currency pairs experienced only minor fluctuations throughout the day.
December 26 (Fri)
The Tokyo area Consumer Price Index (CPI), released in the morning in Japan time, showed a decline. It lowered speculation of the BOJ's additional rate hike and led to a sell-off of the yen. After surging to 156.49 yen, the USDJPY extended its rally to the 156.7 yen range.
As the dollar strengthened against the yen, the EURUSD fell to the 1.176 range. Meanwhile, the GBPUSD hovered around the 1.35 level to conclude the weekly trading session.
Economic Indicators and Statements to Watch this Week
(All times are in GMT)
December 30 (Tue)
- 19:00 U.S.: Minutes of Federal Open Market Committee (FOMC) meeting
December 31 (Wed)
- Closure: Japan (Holiday)
January 1 (Thu)
- Closure: Japan, U.S., U.K (Holiday)
January 2 (Fri)
- Closure: Japan (Holiday)
This Week's Forecast
The following currency pair charts are analyzed using an overlay of the ±1σ and ±2σ standard deviation Bollinger Bands, with a 20-period moving average.
USDJPY
The decline of Tokyo-area CPI figures triggered a sell-off of the yen. However, due to the lingering effects of Katayama's warning against a weak yen, traders seem cautious that the Japanese authorities may intervene in the market if the USDJPY enters the 157 yen range. Meanwhile, due to the New Year's holidays, it is expected that few traders will participate this week, consequently causing a decline in volume. Therefore, it would be better to pause trading.
Next is an analysis of the USDJPY daily chart.
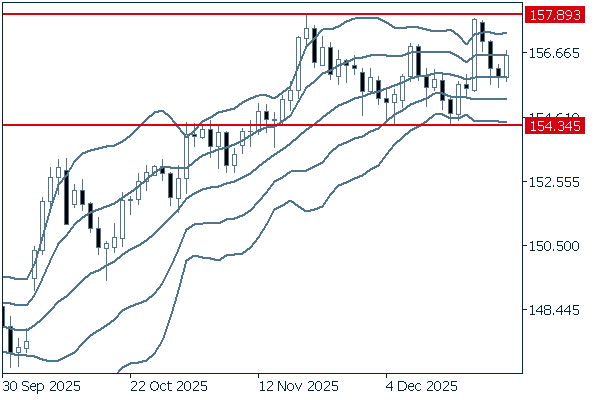
The daily chart shows that the pair has been fluctuating within a fixed range, and that the middle line has just flattened. More specifically, the pair has repeatedly exhibited a long-term pattern of rallying after several days of decline. This pattern held true for last week's fluctuations as well, with the pair rebounding on December 26 after a few days of losses to touch the middle line. Therefore, the pair could utilize this rebound to extend its rally and re-enter the 157 yen range.
We continue with an analysis of the USDJPY weekly chart.
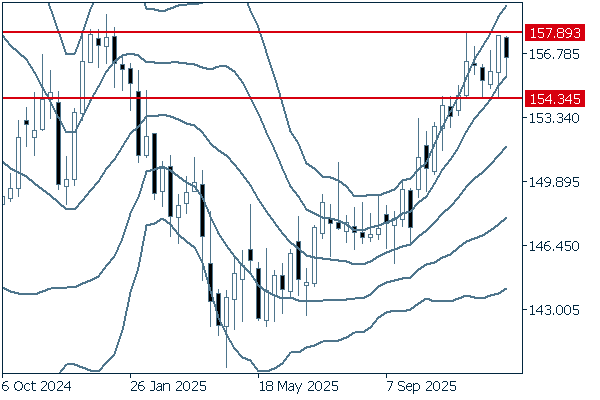
The weekly chart shows that, since surpassing the 154 yen level, the pair has been fluctuating within a fixed range whose upper limit lies in the upper 157 yen range. The latest negative candlestick has a long lower wick. Also, the pair has remained above +1σ for a long time. Therefore, from a weekly standpoint, it is safe to say that the uptrend will likely continue.
EURUSD
Except for the release of the FOMC meeting minutes on December 30, there will be little news or economic data that has an impact on the market. As with the USDJPY, the volume of trading is expected to be thin due to the New Year's holidays. It would be better to pause trading.
Next is an analysis of the EURUSD daily chart.
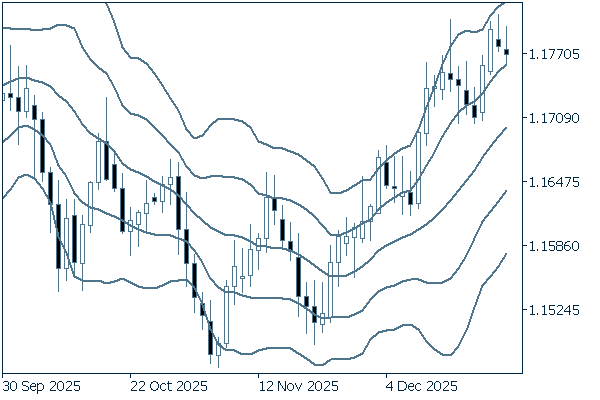
The daily chart shows a pattern in which the pair was pushed down after reaching a high and then rebounded following several days of decline. As long as the pair stays above the 1.17 level, it would be better to make sure to buy on dips.
We continue with an analysis of the EURUSD weekly chart.
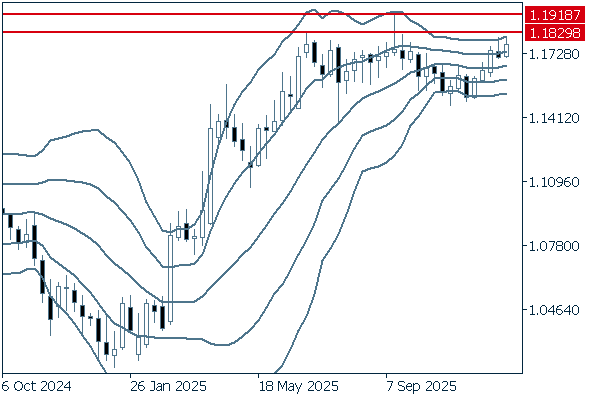
On the weekly chart, the bandwidth is narrowing, and the middle line and other deviation lines are turning almost flat. If the pair breaks above the 1.1829 level, the next target will be 1.19, a yearly high in 2025.
GBPUSD
The GBPUSD continued to advance this December to reach the 1.35 level for the first time in months. This week, there will be little news or economic data that will affect the market. Also, as with the EURUSD, the number of market participants is expected to be low due to the New Year's holidays, which will result in low trading volume. It would be better to pause trading.
Next is an analysis of the GBPUSD daily chart.
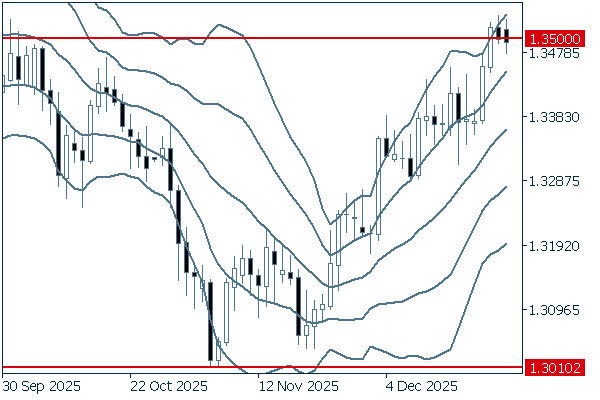
The daily chart shows a pattern in which the pair rebounds after being pushed down for several days and then extends its rally. As a result, the pair was able to return to 1.35. Since the middle line is trending upward, it would be better to make sure to buy when the pair dips.
We continue with an analysis of the GBPUSD weekly chart.
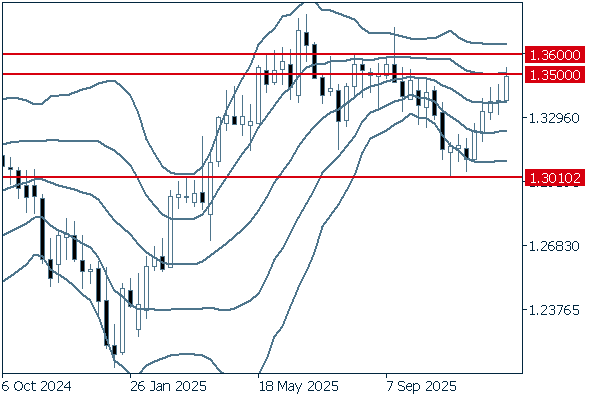
Five consecutive positive candlesticks now appear on the weekly chart, and the pair temporarily entered the 1.35 range last week. The upper wicks on the recent positive candlesticks may signal an increase in selling pressure. However, if the pair breaks above the 1.35 level again, it may extend its uptick to 1.36.
Don't miss trade opportunities with a 99.9% execution rate.
Was this article helpful?
0 out of 0 people found this article helpful.
Thank you for your feedback.
Send