


2025.11.10
This article was :
published
updated
Weekly FX Market Review and Key Points for the Week Ahead
In the foreign exchange market for the week that ended on November 8th, solid U.S. economic figures contributed to the dollar buying. However, the plunge in the Tokyo Stock Exchange (TSE) index and concerns over a possible U.S. economy slowdown led to the yen buying. The USDJPY fluctuated between the upper 152 yen range and the lower 154 yen range. Meanwhile, after experiencing a decline earlier in the week, both the EURUSD and the GBPUSD offset the slide later.
November 3 (Mon)
Since the ISM Manufacturing Index missed expectations, the USDJPY fell below the 154 yen level. However, the pair rebounded to the lower 154 yen range as the dollar maintained its strength against other major currencies.
The EURUSD fell below the 1.15 level, and the GBPUSD hovered within the 1.31 range.
November 4 (Tue)
During Tokyo trading hours, the USDJPY extended its uptick to 154.48 yen. However, Japanese Financial Minister Satsuki Katayama's warning about the weak yen, coupled with the Nikkei 225 index's plunge, triggered traders to prefer a risk-off stance and buy the yen. As a result, the USDJPY fell to 153.3 yen.
Meanwhile, the speech by Chancellor of the Exchequer Rachel Reeves accelerated the sell-off of the pound. Consequently, the GBPUSD fell to just above the 1.30 level. Also, the EURUSD dropped to the 1.147 range as traders bought the dollar due to lowered speculation over rate cuts by the Federal Reserve Board (FRB).
November 5 (Wed)
The TSE experienced another day of plunges as the Nikkei Index fell by 2,400 yen from the previous day's close during the morning session. Consequently, the yen continued to be favored, causing the USDJPY to fall to the 152.9 yen range. However, as the Nikkei index recovered to the 50,000 yen range during the afternoon session, the USDJPY pair rebounded, hitting an intraday high of 154.35 yen.
The EURUSD halted its decline at the 1.146 range and then hovered around that level. The GBPUSD managed to stay above the 1.30 level and rebounded to the 1.305 range.
November 6 (Thu)
The market resumed speculation of rate cuts by the FRB in response to the plunge of the U.S. stock market and the highest level of job cuts, as data from Challenger, Gray & Christmas showed. Intraday, the USDJPY fell to the 152.8 yen range.
The EURUSD and GBPUSD rose as the dollar weakened, reaching the 1.154 and 1.314 ranges, respectively.
November 7 (Fri)
The USDJPY showed a rebound from the previous day's decline and edged up to the 153.5 yen range. However, the pair failed to extend its rally to close the weekly trading session.
The EURUSD fell to the 1.152 range but then rebounded to the 1.159 range during the daily trading session. The GBPUSD concluded the weekly trading session by offsetting the earlier-week slide and reaching the 1.317 range.
Economic Indicators and Statements to Watch this Week
(All times are in GMT)
November 13 (Thu)
- 07:00 U.K.: July-September Quarterly Gross Domestic Product (preliminary GDP)
- 07:00 U.K.: September Monthly Gross Domestic Product (GDP)
- 13:30 U.S.: October Consumer Price Index (CPI)
- 13:30 U.S.: October Consumer Price Index (CPI Core Index)
November 14 (Fri)
- 10:00 Europe: July-September Quarterly Regional Gross Domestic Product (revised regional GDP)
- 13:30 U.S.: October Retail Sales
- 13:30 U.S.: October Retail Sales (excluding automotives)
This Week's Forecast
The following currency pair charts are analyzed using an overlay of the ±1σ and ±2σ standard deviation Bollinger Bands, with a 20-period moving average.
USDJPY
The month-long partial shutdown of the U.S. government may further postpone the release of the October U.S. CPI and retail sales index. Also, the Japanese government is warning against a weak yen. As a result, it seems less likely that the dollar will further strengthen against the yen.
Next is an analysis of the USDJPY daily chart.
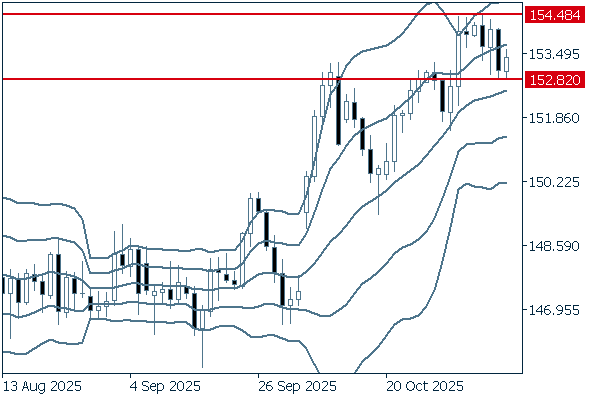
The upward middle line indicates that the pair will likely extend its uptick. However, it's important to keep in mind that a trend reversal may occur if the pair fails to break above the 154.48 yen level and subsequently falls below the 152.82 yen level.
We continue with an analysis of the USDJPY weekly chart.
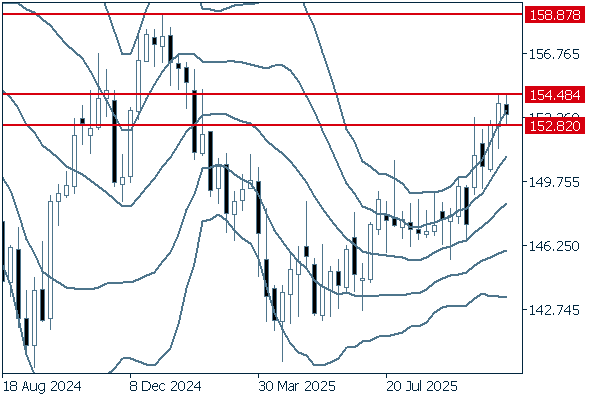
On the weekly chart, the pair is climbing along the upward +2σ. The middle line is also trending upward, and the uptrend band walk is continuing. If the pair falls below the 152.82 yen level, it may experience weak movement for a few weeks. Nevertheless, it is safe to say that the uptrend will likely continue.
EURUSD
The European Central Bank (ECB) decided to keep its policy interest rate unchanged. However, the central bank's upcoming monetary policy is unclear. Meanwhile, the partial shutdown of the U.S. government is delaying the release of major U.S. economic indexes. If the uncertainty brought by the shutdown continues, the dollar may be sold off.
Next is an analysis of the EURUSD daily chart.
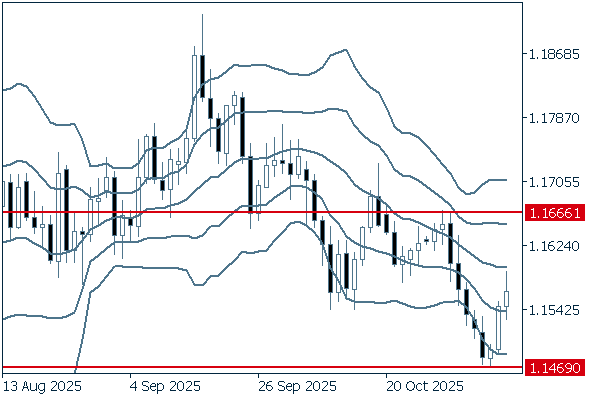
Last week, the pair halted its decline and showed a rebound. However, it failed to extend its rally before reaching the middle line. The mounting selling pressure indicates that traders prefer to sell on the rally. For the pair to reverse the downtrend, it should exceed the 1.1666 level, where the downtrend leading to the recent low on the above chart started.
We continue with an analysis of the EURUSD weekly chart.
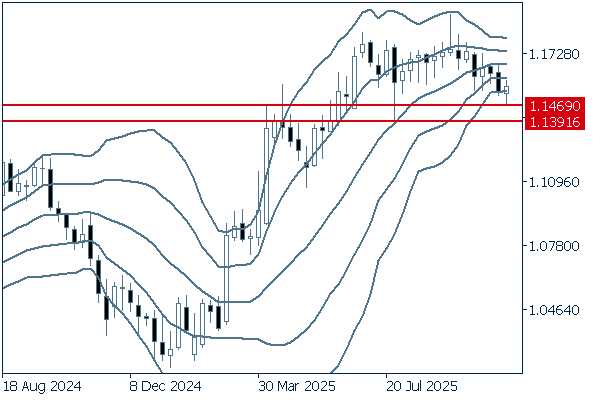
The bandwidth is narrowing, and the middle line is flattening. These indicators suggest that the uptrend has paused, even on the weekly chart. If the pair falls below the 1.1469 level and even drops below the 1.1391 level, it may shift into a downtrend in the medium term.
GBPUSD
The GBPUSD fell earlier last week as the dollar strengthened against the pound. However, as the dollar weakened later in the week, the pair concluded the weekly trading session by offsetting the decline. Although the Bank of England (BOE) decided to keep its policy interest rate unchanged, lingering concerns about an economic slowdown have reinforced market speculation about additional rate cuts by the BOE. It would be good to warn that traders may shift towards the sell-off of the pound.
Next is an analysis of the GBPUSD daily chart.
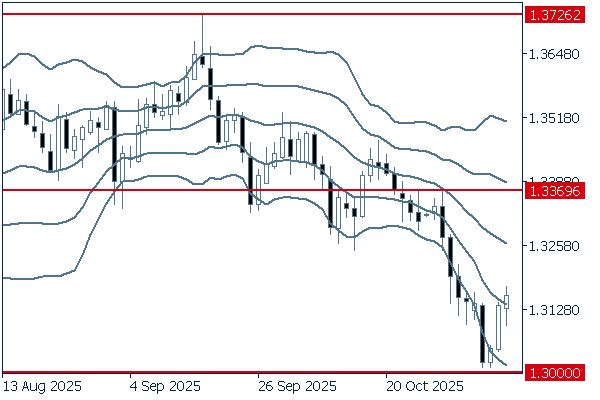
Last week, the pair managed to remain above the 1.30 level, and the real body of the most recent candlestick broke above -1σ. However, for the pair to shift clearly into an uptrend, it should break above the 1.3369 level. For now, it is safe to say that the downtrend will likely continue. It would be better to sell on the rally.
We continue with an analysis of the GBPUSD weekly chart.
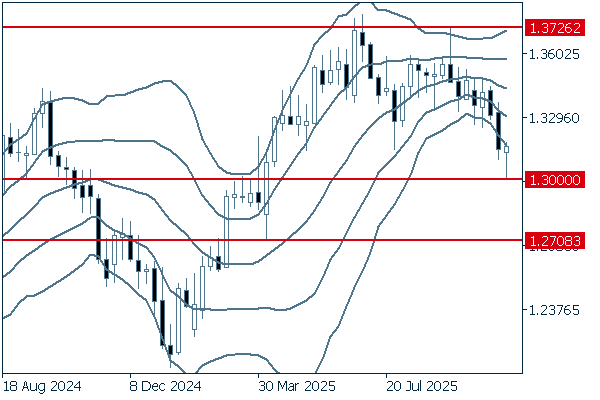
On the weekly chart, after the pair fell below -2σ, buying pressure on the pound led to a rebound. However, as the pair continues to form lower lows, it is safe to say that the downtrend will likely continue. If the pair breaks clearly below the 1.30 level, it may fall to as low as 1.27.
Don't miss trade opportunities with a 99.9% execution rate.
Was this article helpful?
0 out of 0 people found this article helpful.
Thank you for your feedback.
Send