


2025.05.05
This article was :
published
updated
Weekly FX Market Review and Key Points for the Week Ahead
In the foreign exchange market for the week that ended on May 4th, the USDJPY rebounded sharply to come back into the 145 yen range. The yen sold off as the development of the Trump tariffs calmed down and expectations for an early interest rate hike by the Bank of Japan (BOJ) receded.
Despite signs of stagflation in the U.S. economy, the dollar remained steady and strengthened against other major currencies, including the euro and the pound.
April 28 (Mon)
The foreign exchange market started its weekly session without a clear direction ahead of the 100th day speech delivered by U.S. President Donald Trump on April 29th and the upcoming U.S. economic data. The dollar sold off during the New York trading hours, with the USDJPY hitting as low as around 142 yen flat just before the close.
The sell-off in the dollar pushed the EURUSD to the 1.14 range and the GBPUSD to the 1.34 range.
April 29 (Tue)
The USDJPY rebounded from the previous day's decline to come back into the 142.7 yen range. However, the pair fell back to 141.97 yen during the New York trading hours as the downward pressure continued to prevail. The EURUSD failed to extend its gains from the previous day's level and fell back into the 1.139 range. The GBPUSD remained weak, hovering within the 1.34 range.
April 30 (Wed)
Trump's 100th day speech concluded without any major surprises. During the speech, the President insisted on some conditions to exempt the automobile tariffs. As a result, the dollar strengthened against the yen, pushing the USDJPY higher back into the 143 yen range. Although the weaker-than-expected ADP employment report and preliminary U.S. quarterly GDP figures pushed the pair lower, it then returned to the 143 yen range.
The dollar also strengthened against the euro and the pound. The EURUSD fell to the 1.131 range, and the GBPUSD declined to the 1.330 range.
May 1 (Thu)
At the much-focused BOJ Monetary Policy Meeting, the central bank left its policy interest rate unchanged and revised down its forecasts of the Japanese economy's growth and inflation rate. In addition, following Governor Kazuo Ueda's post-meeting comments, the market significantly lowered expectations for another rate hike in the near future. As a result, traders bought the dollar, and the USDJPY surged into the 145.6 yen range.
As the dollar strengthened, the EURUSD broke below the 1.13 level, and the GBPUSD weakened to the upper 1.32 range.
May 2 (Fri)
The Chinese Commerce Ministry said that it would consider trade talks with the U.S. This news helped the USDJPY climb to the 145.92 yen range. The pair then fell back below the 144 yen level. Later, thanks to the dollar buyback, the pair concluded the weekly trading session just below the 145 yen level.
The EURUSD and GBPUSD were also affected by the dollar's fluctuations. After rising to the 1.138 range, the former fell back below the 1.13 level. The latter rose just under 1.33 but then fell back to the 1.326 range.
Economic Indicators and Statements to Watch this Week
(All times are in GMT)
May 5 (Mon)
- 14:00 U.S.: April ISM Non-Manufacturing PMI (composite)
May 7 (Wed)
- 18:00 U.S.: Federal Reserve Open Market Committee (FOMC) meeting, post-meeting policy rate announcement
- 18:30 U.S.: Regular press conference by Federal Reserve Chairman Jerome Powell
- 23:50 Japan: Summary of Opinions at the Monetary Policy Meeting
May 8 (Thu)
- 11:00 U.K.: Bank of England (BOE) policy interest rate announcement
- 11:00 U.K.: Minutes of Bank of England Monetary Policy Committee (MPC) meeting
This Week's Forecast
The following currency pair charts are analyzed using an overlay of the ±1σ and ±2σ standard deviation Bollinger Bands, with a 20-period moving average.
USDJPY
While Trump has strongly urged the FRB to cut interest rates, the U.S. central bank is expected to decide to leave its policy rate unchanged at the upcoming FOMC meeting. As the market reduces speculation of further rate hikes by the BOJ, the USDJPY is likely to rise in the near future.
Next is an analysis of the USDJPY daily chart.
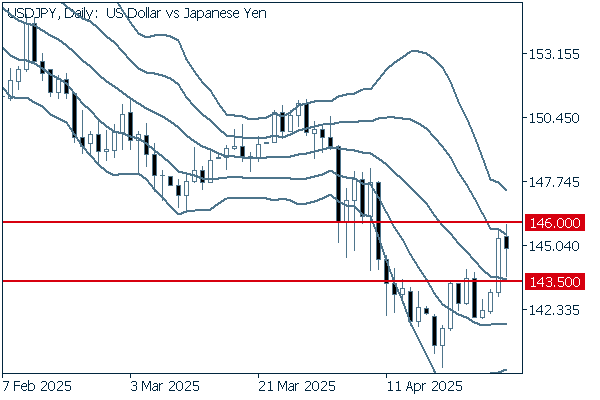
Last week, the pair fell in front of the resistance level of 146 yen. Now it is important to see whether the pair can rebound and cross above this level. If so, the pair may continue to rise. On the other hand, if the pair falls below the support line lying at 143.5 yen, which is equivalent to the level of the middle line, it may fall as low as around 140 yen.
We continue with an analysis of the USDJPY weekly chart.
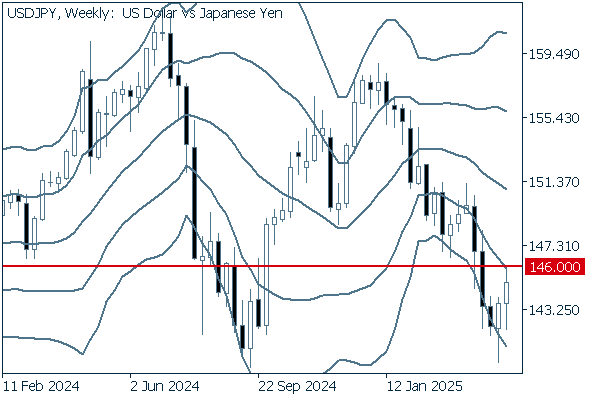
The weekly chart suggests that the pair is facing selling pressure on a rally in the medium term. However, if the pair can clearly break above the 146 yen level, it could be a sign of a trend reversal. Conversely, if the pair is pushed back here, the downtrend is likely to continue. The bottom line is that it is important to see how the pair fluctuates around this psychological level.
EURUSD
As traders have been buying back the dollar, the EURUSD is struggling to move higher. Nevertheless, it can be said that the euro remains quite steady. Still, the results of the FOMC meeting may put downward pressure on the euro. It is important to keep an eye on the dollar's behavior.
Next is an analysis of the EURUSD daily chart.
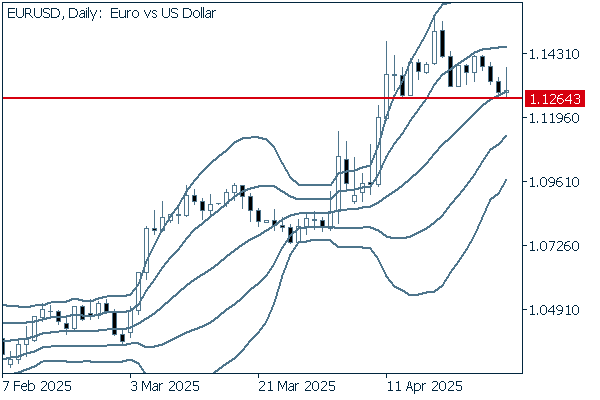
The pair had risen steadily since March. However, now that this upward trend has paused, the pair is on the verge of breaking below the middle line. It will be crucial to see whether or not the pair clearly breaks below the support line lying at 1.1264 to determine whether the pair will resume rising or continue falling.
We continue with an analysis of the EURUSD weekly chart.
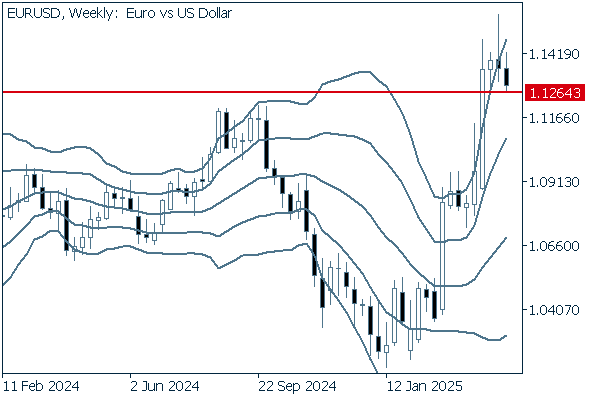
The weekly chart shows that the pair maintains a strong upward momentum. However, after hitting a new high two weeks ago, the pair is struggling to move higher. If the pair breaks below the 1.1264 level, the low from last week, it could extend its decline towards the level of the middle line.
GBPUSD
The GBPUSD started last week's trading session by hitting a new high. The pound, since then, has weakened as the dollar is regaining its upward trend. Meanwhile, the BOE is expected to cut interest rates by 0.25% at the May 8th meeting.
Now, we analyze the daily GBPUSD chart.
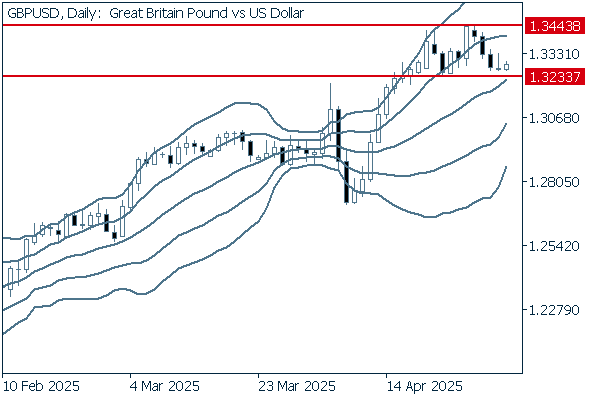
After the pound's upward trend paused, the pair is now on a track to fall from its recent high of 1.3443. If the pair clearly breaks below the recent low of 1.3233 and even falls below the middle line, it could be a sign of a trend reversal.
We continue with an analysis of the GBPUSD weekly chart.
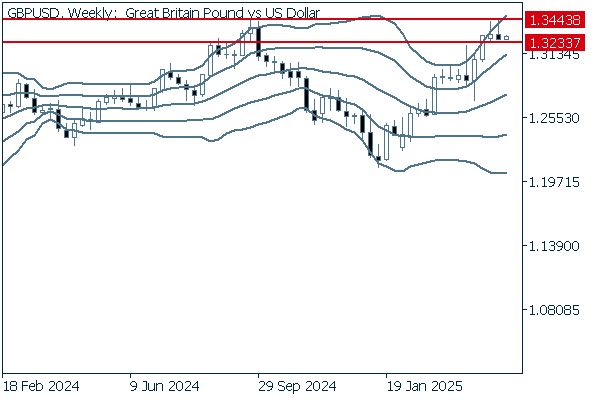
The weekly chart shows that the pair maintains its upward momentum. However, long upper wicks on the recent candlesticks suggest that the market is overheating. If the pair breaks above this level, it may continue to rise. On the other hand, if the pair falls back and closes below the 1.3233 level, it could be a sign of a trend reversal.
Was this article helpful?
0 out of 0 people found this article helpful.
Thank you for your feedback.
Send