


2025.04.28
This article was :
published
updated
Weekly FX Market Review and Key Points for the Week Ahead
In the foreign exchange market for the week that ended on April 27th, the dollar strengthened against the yen as a series of dollar sell-offs eased. After falling to the 139 yen range, the USDJPY rebounded to around 144 yen by the end of the week. Meanwhile, the EURUSD paused its rally, and the GBPUSD also struggled to gain momentum towards the end of the week.
Some major events, such as the G20 finance ministers' meeting and the U.S.-Japan finance ministers' talks, have passed smoothly. The market was also supported by expectations that the U.S.-China trade tensions would ease.
April 21 (Mon)
Before the start of the weekly trading session, the U.S. President Donald Trump was reportedly considering firing Federal Reserve Board (FRB) Chairman Jerome Powell, accelerating the sell-off in U.S. assets. The USDJPY plummeted to the 140.6 yen range. The EURUSD rose to the 1.157 range during the trading hours, while the GBPUSD also remained firm, hitting the 1.34 range.
April 22 (Tue)
Earlier in the day, the continued downward momentum of the dollar from the previous day pushed the USDJPY down to 139.88 yen. However, later in the New York trading session, the dollar rebounded sharply to the 142.5 yen range following President Trump's backtracking on his consideration of firing Powell.
As the dollar strengthened, the EURUSD fell to the lower 1.13 range, and the GBPUSD broke below the 1.33 level to conclude the daily trading session.
April 23 (Wed)
The continued upward momentum for the dollar pushed the USDJPY above the 143 yen level. After a brief decline, the pair resumed its rally and reached the 143.5 yen range after President Trump was reported to be considering softening his stance on China.
The EURUSD, which fell to the 1.130 level, showed a sluggish recovery and concluded the daily trading session in the 1.131 range. The GBPUSD rebounded after falling to the 1.323 range. However, the rally didn't last long as the pair fell back to the 1.325 range.
April 24 (Thu)
The dollar's rally paused, and the USDJPY fell to the 142.2 yen range. Later, as the decline slowed down, the pair rebounded to the 142.8 yen range during the trading hours. The market was relatively quiet ahead of the U.S.-Japan finance ministers' meeting.
The EURUSD rose after the previous day's decline slowed. However, the pair failed to break above the 1.14 level. The steady GBPUSD rebounded to the 1.33 range.
April 25 (Fri)
The U.S. and Japanese finance ministers did not discuss the currency target during their meeting. In addition, some news outlets reported that China would exempt some imports from the U.S. from tariffs. These developments pushed the dollar higher as the USDJPY exceeded the 144 yen level during the trading hours.
Meanwhile, the EURUSD hovered in the 1.13 range throughout the day. The GBPUSD fell to the 1.328 range but then showed a slight recovery to conclude the weekly session.
Economic Indicators and Statements to Watch this Week
(All times are in GMT)
April 30 (Wed)
- 09:00 Europe: January-March quarterly regional gross domestic product (preliminary regional GDP)
- 12:15 U.S.: April ADP National Employment Report
- 12:30 U.S.: January-March quarterly employment cost index
- 12:30 U.S.: January-March quarterly real gross domestic product (preliminary GDP)
- 14:00 U.S.: March personal consumption expenditures (PCE deflator)
- 14:00 U.S.: March personal consumption expenditures (PCE core deflator, excluding food and energy)
May 1 (Thu)
- TBA Japan: Bank of Japan (BOJ) Monetary Policy Meeting, post-meeting policy rate announcement
- TBA Japan: BOJ Outlook Report
- 06:30 Japan: Regular press conference by BOJ Governor Kazuo Ueda
- 14:00 U.S.: April ISM Manufacturing PMI
May 2 (Fri)
- 09:00 Europe: April Harmonised Index of Consumer Prices (preliminary HICP)
- 09:00 Europe: April Harmonised Index of Consumer Prices (preliminary HICP core index)
- 12:30 U.S.: April change in nonfarm payrolls
- 12:30 U.S.: April unemployment rate
- 12:30 U.S.: April average hourly earnings
This Week's Forecast
The following currency pair charts are analyzed using an overlay of the ±1σ and ±2σ standard deviation Bollinger Bands, with a 20-period moving average.
USDJPY
Concerns over the tariff conflict between the U.S. and China are likely to linger. In the meantime, the end of the dollar's sell-off momentum is expected to be near as trade talks between the Trump administration and Japan and other allies are progressing. Nevertheless, it is important to remain cautious about headline-driven volatility.
Next is an analysis of the USDJPY daily chart.
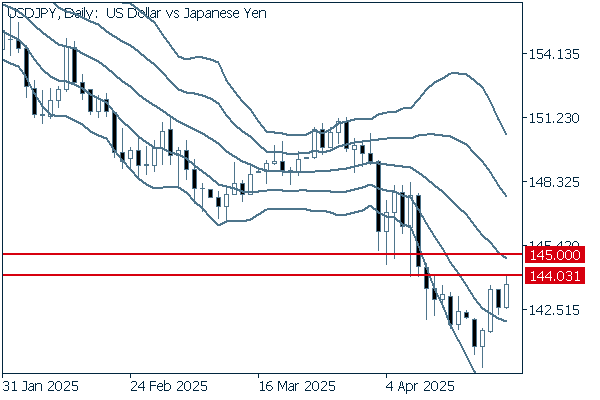
On the daily chart, the middle line is still moving downward. However, the pair bounced back last week and is now widening the gap from -2 pips. Once it breaks above the recent high of the 144.03 yen level, the pair is likely to reach as high as the 145 yen level. Moreover, if the pair breaks above that level, a trend reversal to the medium-term uptrend could take place.
We continue with an analysis of the USDJPY weekly chart.
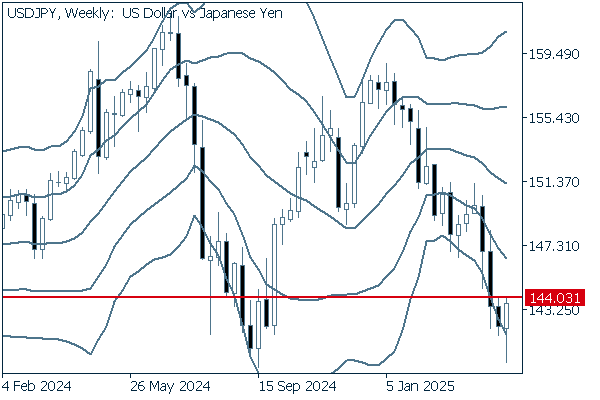
The long lower wick on the latest positive candlestick indicates that the buying pressure is mounting. Last week, the pair clearly broke above -2σ to close the weekly session. However, if the pair fails to break above 144.03 yen, the weekly high of the previous week, the pair could face a sell-off on the rally and re-enter the downtrend.
EURUSD
The euro's uptrend has stalled after the EURUSD entered the 1.15 range. The pair is now struggling to find a clear direction. Meanwhile, the market is watching the development of the U.S.-China trade talks, hoping for a de-escalation of the Trump tariffs, as well as waiting for the important U.S. employment figures to be released this week. The bottom line is that the dollar's behavior will dominate the market.
Next is an analysis of the EURUSD daily chart.
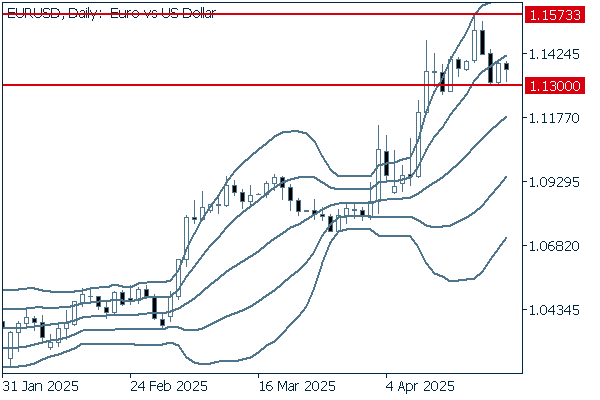
The middle line maintains a steady upward trend. However, the euro's uptrend has stalled, and the pair is now struggling to find a clear direction. If the pair bottoms out around the support line lying at the 1.13 level and resumes its upward movement, the pair will attempt to renew the high. On the other hand, in case the pair breaks below the support line, it may fall to around the middle line.
We continue with an analysis of the EURUSD weekly chart.
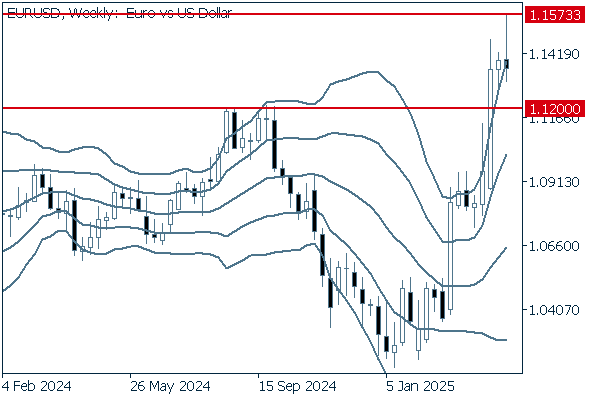
Last week, increasing selling pressure pushed the pair down from a level well above +2σ to within the band. The pair may fall to the 1.12 level, which was once a resistance line, as traders may correct their positions. However, it is safe to say that the uptrend is likely to continue.
GBPUSD
Similar to the EURUSD, the GBPUSD has been struggling to find a clear direction since reaching the 1.34 range. As long as the uncertainty over the trade conflict persists, the dollar's behavior will continue to dominate the market and consequently determine the direction.
Now, we analyze the daily GBPUSD chart.
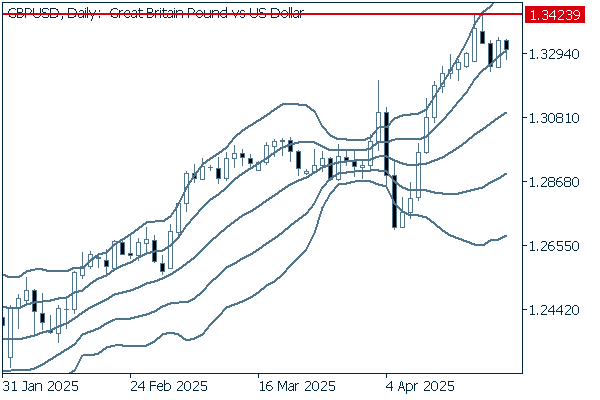
Last week, after reaching around +2σ, the pair was pushed down to around +1σ. Then, the continuing upward band walk supported the pair to show the rebound. It will be important to watch whether the pair can break above the recent high of 1.3423.
We continue with an analysis of the GBPUSD weekly chart.
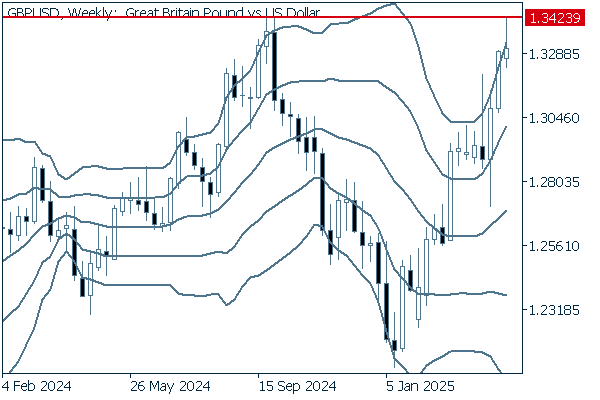
The weekly chart shows that the pair is still in an upward trend. However, a long upper wick on the most recent positive candlestick indicates that some traders may be cautious about the euro's current price range. Meanwhile, a strong resistance line can be drawn at 1.3423, the high set in May 2024. If the main body of the candlestick crosses the line, it will be a sign that the pair may continue to rise.
Was this article helpful?
0 out of 0 people found this article helpful.
Thank you for your feedback.
Send