


2025.02.17
This article was :
published
updated
Weekly FX Market Review and Key Points for the Week Ahead
In the foreign exchange market for the week that ended on February 16th, the dollar initially strengthened against the yen on a series of tariff-related news. President Donald Trump announced that the U.S. would impose a 25% tariff on imported steel and aluminum, while the European Union announced countermeasures. However, the dollar's rally stalled beneath 155 yen on February 12th.
As little news came out of Japan regarding its central bank, some traders corrected their positions to sell the yen. However, dollar selling prevailed last week. In addition, President Trump's proposal for a ceasefire in the Russia-Ukraine conflict encouraged traders to buy the euro.
February 10 (Mon)
President Trump announced that his administration had decided to impose a 25% tariff on imported steel and aluminum. Although the market had feared that traders would take a risk-averse reaction, there was no significant trend of dollar buying. The USDJPY fluctuated between the upper 151 yen range and the lower 152 yen range throughout the day.
In response to Trump's announcement, the E.U. announced counter-tariffs against the U.S. However, many traders sought to gauge the impact of the tariff conflict on the Eurozone economy. As a result, the EURUSD fluctuated tightly in the lower 1.03 range. The GBPUSD touched above the 1.24 level but then fell back to the 1.23 range.
February 11 (Tue)
Although concerns over the Trump administration's tariff policy persisted, the market's reaction remained limited. The USDJPY fluctuated narrowly after reaching the middle of the 152 yen range.
The EURUSD strengthened against the dollar, touching 1.038. The GBPUSD followed suit, reaching the middle of the 1.24 range.
February 12 (Wed)
The better-than-expected January U.S. Consumer Price Index (CPI) encouraged traders to buy the dollar, lifting the USDJPY to 154.8 yen.
The EURUSD reached a high in the 1.042 range, while the GBPUSD experienced some fluctuations but generally remained in the 1.24 range.
February 13 (Thu)
President Trump held a phone conference with Russian President Vladimir Putin to discuss a ceasefire in the Russia-Ukraine conflict. It was also reported that China had made a proposal to Trump to hold a U.S.-Russian summit to help end the conflict. As the market anticipated that these developments could lower geopolitical risk, traders sold the dollar and the yen. The EURUSD jumped to the 1.046 level, while the GBPUSD broke above the 1.25 level.
The U.S. Producer Price Index (PPI) for January, released on this day, beat expectations. However, as with the previous day's U.S. CPI for January, this figure indicated a cautious stance by the Federal Reserve Board toward lowering interest rates. As a result, the USDJPY plunged to the upper 152 yen range.
February 14 (Fri)
The market regained calm after the turmoil surrounding the Trump tariffs earlier this week. The USDJPY fluctuated in the 152 yen range early in the day. However, the poor results of the U.S. Retail Sales for January prompted traders to sell the dollar. Consequently, the pair fell as low as 152.02 yen before managing to close the weekly trading session within the 152 yen range.
The EURUSD also strengthened against the dollar, briefly climbing to 1.05, while the GBPUSD also touched above 1.26.
Economic Indicators and Statements to Watch this Week
(All times are in GMT)
February 16 (Sun)
- 23:50 Japan: October-December quarterly real gross domestic product (preliminary GDP)
February 19 (Wed)
- 19:00 U.S.: Federal Reserve Open Market Committee (FOMC) meeting minutes
February 20 (Thu)
- 23:30 Japan: January Consumer Price Index (CPI, all items, year-on-year data)
- 23:30 Japan: January Consumer Price Index (CPI, all items less fresh food)
- 23:30 Japan: January Consumer Price Index, Japan (CPI, all items less fresh food and energy)
This Week's Forecast
The following currency pair charts are analyzed using an overlay of the ±1σ and ±2σ standard deviation Bollinger Bands, with a 20-period moving average.
USDJPY
The minutes of the FOMC meeting and the January Japanese Consumer Price Index (CPI) will be released this week. Additionally, traders will be monitoring the development of the Trump administration, as the volatile market could react nervously to a single media report on his tariff policy.
Next is an analysis of the USDJPY daily chart.
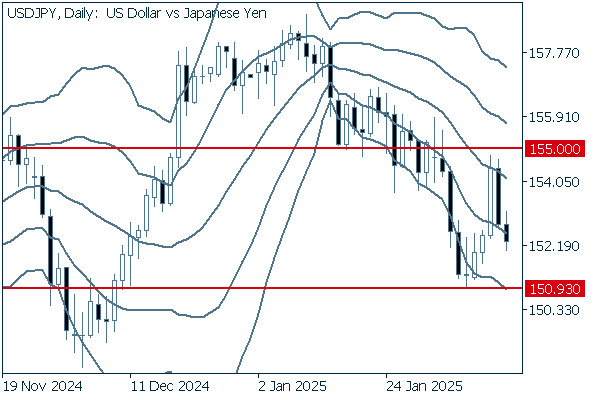
Last week, the pair failed to make a new high as it plummeted from beneath 155 yen to just above 152 yen. If it breaks below 152 yen, the pair will likely fall as low as 150.93 yen, the low set on February 7th. Unless the pair breaks above the middle line, it is safe to say that the downtrend will continue.
We continue with an analysis of the USDJPY weekly chart.
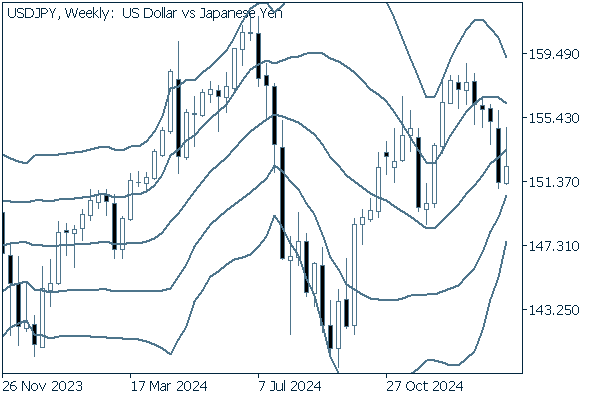
On the weekly chart, the real body lies beneath the upward middle line. While there is a possibility that the pair's current downtrend will come to a halt and an uptrend will begin, the prevailing selling pressure on the dollar suggests that the downside scenario is more likely.
EURUSD
As the Russia-Ukraine conflict is being steered towards a ceasefire, traders are being encouraged to buy the euro, indicating that the EURUSD's downtrend may be coming to an end. However, it is too early to be optimistic, as the market is still exposed to the risk of the U.S. tariff policy.
Next is an analysis of the EURUSD daily chart.
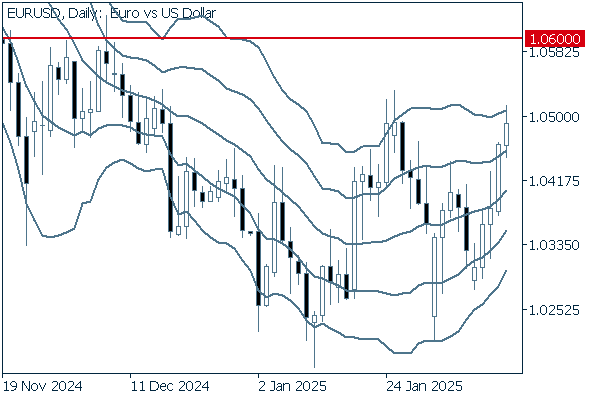
On the daily chart, the pair closed last week's trading session with five consecutive positive candlesticks. If the current rally continues, the pair could surpass the 1.06 level to break above the current plateau status from last November and go even higher.
We continue with an analysis of the EURUSD weekly chart.
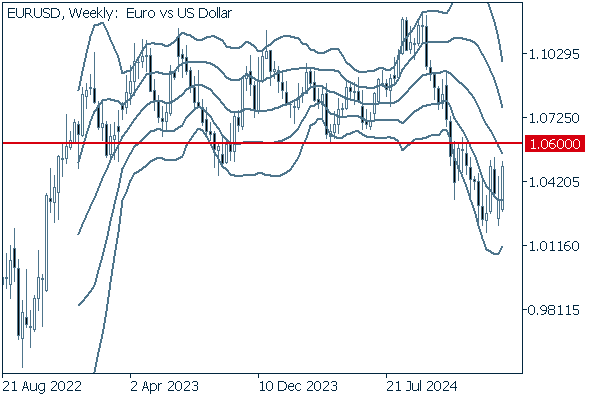
On the weekly chart, the pair has been hovering around -1σ. However, as the downward band walk has ended, the pair is approaching the middle line. If it can break above the 1.05 and then the 1.06 levels, there is a higher possibility that the pair may return to the box-shaped range that has been formed since 2022.
GBPUSD
Thanks to better-than-expected U.K. GDP figures released on February 13th, the GBPUSD rebounded to the 1.26 level the following day. However, traders remain bearish on the pound as the negative outlook for the U.K.'s economic growth lingers. It seems that the dollar will continue to dominate the pair.
Now, we analyze the daily GBPUSD chart.
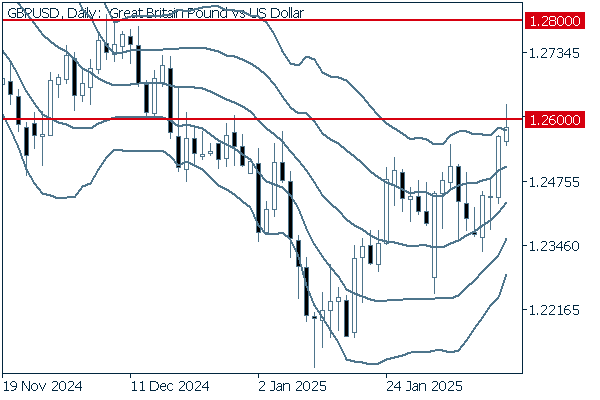
After hovering around 1.25, the pair began to rise, and as the upper tick on the chart shows, it touched above the 1.26 level on February 14th. If it is confirmed on the chart that the real body breaks above 1.26, the pair will be able to return to the price range of last November.
We continue with an analysis of the GBPUSD weekly chart.
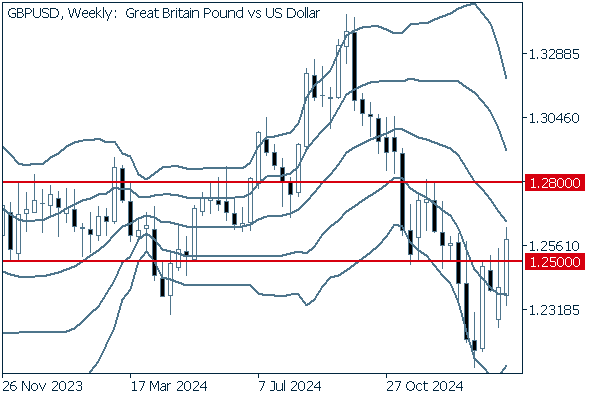
Although the middle line on the weekly chart remains in a downward direction, the pair broke above the 1.25 level last week and is now approaching the middle line. The next target appears to be the 1.28 level.
Was this article helpful?
53 out of 98 people found this article helpful.
Thank you for your feedback.
Send