2025.01.13
- Features
-
Services/ProductsServices/ProductsServices/Products

Learn more about the retail trading conditions, platforms, and products available for trading that FXON offers as a currency broker.
You can't start without it.
Trading Platforms Trading Platforms Trading Platforms
Features and functionality comparison of MetaTrader 4/5, and correspondence table of each function by OS
Two account types to choose
Trading Account Types Trading Account Types Trading Account Types
Introducing FXON's Standard and Elite accounts.
close close

-
SupportSupportSupport

Support information for customers, including how to open an account, how to use the trading tools, and a collection of QAs from the help desk.
Recommended for beginner!
Account Opening Account Opening Account Opening
Detailed explanation of everything from how to open a real account to the deposit process.
MetaTrader4/5 User Guide MetaTrader4/5 User Guide MetaTrader4/5 User Guide
The most detailed explanation of how to install and operate MetaTrader anywhere.
FAQ FAQ FAQ
Do you have a question? All the answers are here.
Coming Soon
Glossary Glossary GlossaryGlossary of terms related to trading and investing in general, including FX, virtual currencies and CFDs.
News News News
Company and License Company and License Company and License
Sitemap Sitemap Sitemap
Contact Us Contact Us Contact Us
General, personal information and privacy inquiries.
close close

- Promotion
- Trader's Market
- Partner
-
close close
Learn more about the retail trading conditions, platforms, and products available for trading that FXON offers as a currency broker.
You can't start without it.
Features and functionality comparison of MetaTrader 4/5, and correspondence table of each function by OS
Two account types to choose
Introducing FXON's Standard and Elite accounts.
Support information for customers, including how to open an account, how to use the trading tools, and a collection of QAs from the help desk.
Recommended for beginner!
Detailed explanation of everything from how to open a real account to the deposit process.
The most detailed explanation of how to install and operate MetaTrader anywhere.
Do you have a question? All the answers are here.
Coming Soon
Glossary of terms related to trading and investing in general, including FX, virtual currencies and CFDs.
General, personal information and privacy inquiries.
Useful information for trading and market information is posted here. You can also view trader-to-trader trading performance portfolios.
Find a trading buddy!
Share trading results among traders. Share operational results and trading methods.
- Legal Documents TOP
- Client Agreement
- Risk Disclosure and Warning Notice
- Order and Execution Policy
- Complaints Procedure Policy
- AML/CFT and KYC Policy
- Privacy Policy
- eKYC Usage Policy
- Cookies Policy
- Website Access and Usage Policy
- Introducer Agreement
- Business Partner Agreement
- VPS Service Terms and Condition

This article was :
published
updated
Weekly FX Market Review and Key Points for the Week Ahead
In the foreign exchange market for the week that ended on January 12th, the dollar dominated other major currencies. Meanwhile, the market experienced nervous fluctuations in response to President-elect Donald Trump's potential tariff policies and strong U.S. economic indicators.
The USDJPY temporarily touched the upper 158 yen range. However, traders took profits after the release of the U.S. job figures and shifted to risk aversion. As a result, the dollar was subdued by the profit-taking momentum.
Meanwhile, the EURUSD and GBPUSD continued to show relatively moderate downtrends. The pound was sold off in response to the rise in U.K. bond yields and market uncertainty.
January 6 (Mon)
The USDJPY started the week trading in the lower 157 yen range. Later, the pair fell back to the lower 156 yen range as a media report that an aide to President-elect Donald Trump was considering imposing tariffs only on major imports weakened the dollar.
However, Trump's denial of the report fueled the dollar's rebound to the mid-157 yen range.
January 7 (Tue)
The Eurozone's all-items HICP (Harmonized Index of Consumer Prices) rose by 2.4% year-on-year in December, while the HICP core index rose by 2.7%. These predictable results pushed the EURUSD into a downtrend.
On the other hand, the USDJPY fell to the lower 157 yen range after Japanese Finance Minister Katsunobu Kato commented that his country would respond to excessive volatility in the currency market. However, the result of the U.S. December ISM Non-Manufacturing Index came in at 54.1, exceeding the forecast of 53.3, which fueled dollar buying and pushed the USDJPY back to the 158 yen level.
January 8 (Wed)
The USDJPY rose to the mid-158 yen range as the rise in U.S. long-term interest rates strengthened the dollar. However, the ADP National Employment Report registered an increase of 122,000 jobs in December, missing forecasts for a 140,000 increase. The weaker-than-expected result slowed the dollar's upward momentum. In addition, the FOMC minutes released the same day revealed no significant surprises.
January 9 (Thu)
With no major economic releases, the pause in the rise of U.S. long-term interest rates slightly weakened the dollar. Although the USDJPY fell to the mid-157 yen range, the pair fluctuated moderately throughout the day.
January 10 (Fri)
The U.S. Bureau of Labor Statistics reported the December employment figures. Total nonfarm payroll employment increased by 256,000, far exceeding the forecast of a 160,000 increase, and the unemployment rate registered a lower-than-expected 4.1%. The reaffirmed solidity of the U.S. labor market bolstered the dollar as the USDJPY surged to the upper 158 yen range.
However, as the Dow Jones Index temporarily plunged over 700 points, traders took a risk-averse stance, and the USDJPY pulled back.
Meanwhile, the EURUSD and GBPUSD continued to fall as a result of the U.S. job figures.
Economic Indicators and Statements to Watch this Week
(All times are in GMT)
January 15 (Wed)
- 13:30 U.S: December Consumer Price Index(CPI)
- 13:30 U.S: December Consumer Price Index(CPI core index)
January 16 (Thu)
- 07:00 U.K.: November monthly gross domestic product (GDP, month-on-month data)
- 12:30 Europe: European Central Bank (ECB) Governing Council meeting minutes
- 13:30 U.S.: December retail sales
January 17 (Fri)
- 10:00 Europe: December Harmonised Index of Consumer Prices (revised HICP)
- 10:00 Europe: December Harmonised Index of Consumer Prices (revised HICP core index)
This Week's Forecast
The following currency pair charts are analyzed using an overlay of the ±1 and ±2 standard deviation Bollinger Bands, with a period of 20 days.
USDJPY
The better-than-expected U.S. job figures released on January 10th lowered expectations for a Federal Reserve Board interest rate cut and strengthened the dollar. Thus, the yen is likely to weaken further. However, as some media outlets are reporting that the Bank of Japan is expected to raise interest rates earlier, it is possible that the yen temporarily strengthens against the dollar.
Next is an analysis of the USDJPY daily chart.
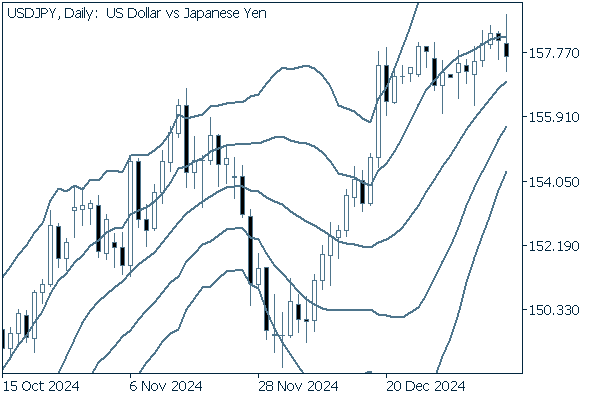

Last week, the pair gradually rose along +1σ amid moderate fluctuations to hit a new high. The upward middle line indicates that the uptrend is likely to continue.
We continue with an analysis of the USDJPY weekly chart.
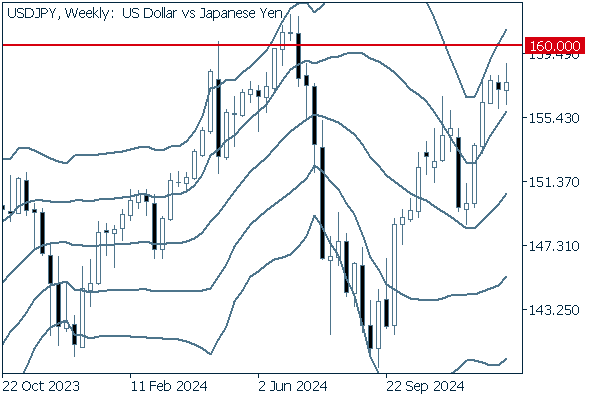

The band walk continues to show an uptrend, and so does the middle line. It is safe to say that the pair's uptrend will continue and may soon reach the 160 yen level.
EURUSD
The dollar continued to strengthen against the euro following strong U.S. economic data. Given the wide gap in economic growth expectations between the U.S. and Europe, some believe that the dollar will strengthen even further after Donald Trump's inauguration on January 20th and that the pair could fall to parity (USD 1.00).
Next is an analysis of the EURUSD daily chart.
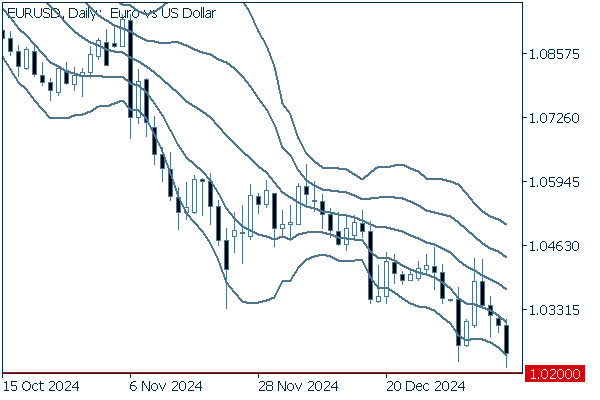

The pair managed to avoid hitting 1.02 to make a brief rebound. However, after failing to break above the middle line, the pair resumed its downtrend and broke the previous week's low. The downtrend is likely to continue.
We continue with an analysis of the EURUSD weekly chart.
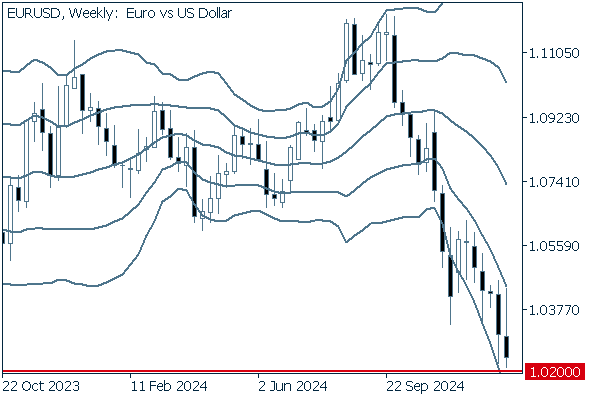

On the weekly chart, five consecutive bearish candlesticks have appeared, and the band walk shows a downward trend. It is safe to say that the downtrend will continue as the pair may break below the 1.02 level.
GBPUSD
Widespread financial uncertainty in the U.K. accompanies the selling of U.K. bonds and a rise in yields. As a result, the selling of the pound accelerates. Like the EURUSD, the GBPUSD is also affected by the strong dollar based on strong U.S. economic data.
Now, we analyze the daily GBPUSD chart.
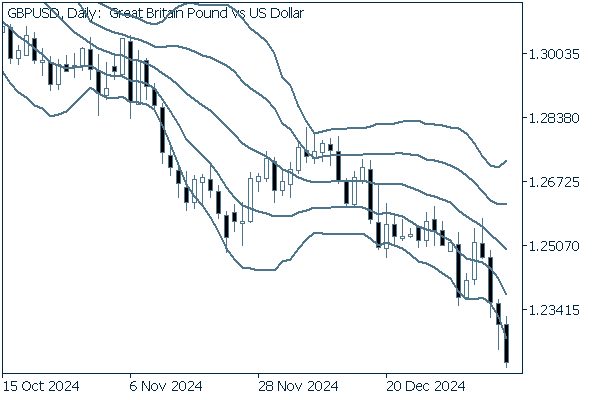

The pair touched the middle line early last week but then plunged below -2σ. The downtrend is likely to continue.
We continue with an analysis of the GBPUSD weekly chart.
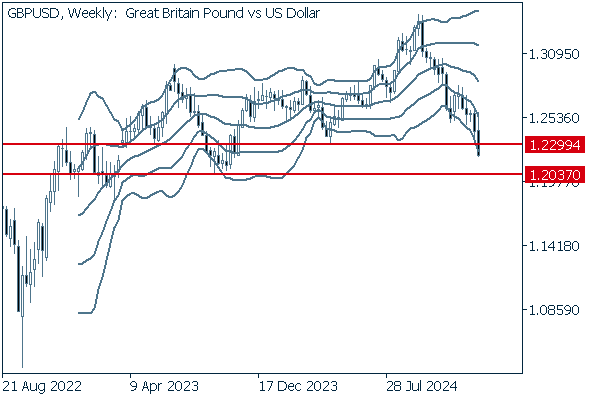

Amid the continuous downtrend, the pair broke below 1.2299, the 2024 low. It is safe to say that this trend will not end anytime soon as the pair may drop as low as 1.2037, the low set in October 2023.
Was this article helpful?
0 out of 0 people found this article helpful.
Thank you for your feedback.
FXON uses cookies to enhance the functionality of the website and your experience on it. This website may also use cookies from third parties (advertisers, log analyzers, etc.) for the purpose of tracking your activities. Cookie Policy
