2024.06.10
- Features
-
Services/ProductsServices/ProductsServices/Products

Learn more about the retail trading conditions, platforms, and products available for trading that FXON offers as a currency broker.
You can't start without it.
Trading Platforms Trading Platforms Trading Platforms
Features and functionality comparison of MetaTrader 4/5, and correspondence table of each function by OS
Two account types to choose
Trading Account Types Trading Account Types Trading Account Types
Introducing FXON's Standard and Elite accounts.
close close

-
SupportSupportSupport

Support information for customers, including how to open an account, how to use the trading tools, and a collection of QAs from the help desk.
Recommended for beginner!
Account Opening Account Opening Account Opening
Detailed explanation of everything from how to open a real account to the deposit process.
MetaTrader4/5 User Guide MetaTrader4/5 User Guide MetaTrader4/5 User Guide
The most detailed explanation of how to install and operate MetaTrader anywhere.
FAQ FAQ FAQ
Do you have a question? All the answers are here.
Coming Soon
Glossary Glossary GlossaryGlossary of terms related to trading and investing in general, including FX, virtual currencies and CFDs.
News News News
Company and License Company and License Company and License
Sitemap Sitemap Sitemap
Contact Us Contact Us Contact Us
General, personal information and privacy inquiries.
close close

- Promotion
- Trader's Market
- Partner
-
close close
Learn more about the retail trading conditions, platforms, and products available for trading that FXON offers as a currency broker.
You can't start without it.
Features and functionality comparison of MetaTrader 4/5, and correspondence table of each function by OS
Two account types to choose
Introducing FXON's Standard and Elite accounts.
Support information for customers, including how to open an account, how to use the trading tools, and a collection of QAs from the help desk.
Recommended for beginner!
Detailed explanation of everything from how to open a real account to the deposit process.
The most detailed explanation of how to install and operate MetaTrader anywhere.
Do you have a question? All the answers are here.
Coming Soon
Glossary of terms related to trading and investing in general, including FX, virtual currencies and CFDs.
General, personal information and privacy inquiries.
Useful information for trading and market information is posted here. You can also view trader-to-trader trading performance portfolios.
Find a trading buddy!
Share trading results among traders. Share operational results and trading methods.
- Legal Documents TOP
- Client Agreement
- Risk Disclosure and Warning Notice
- Order and Execution Policy
- Complaints Procedure Policy
- AML/CFT and KYC Policy
- Privacy Policy
- eKYC Usage Policy
- Cookies Policy
- Website Access and Usage Policy
- Introducer Agreement
- Business Partner Agreement
- VPS Service Terms and Condition

This article was :
published
updated
Weekly FX Market Review and Key Points for the Week Ahead
In the week ending June 9, the USDJPY dropped from above 157 to below 155 in the first half of the week, driven down by weak U.S. economic indicator releases. However, price movements stabilized mid-week, and the USDJPY temporarily returned to above 157 after a stronger-than-expected U.S. jobs report released on Friday.
In addition, though the EURUSD and GBPUSD had been largely directionless, a rising dollar thanks to the aforementioned jobs report led both pairs to close down sharply.
Let's review the market movements through the week.
On Monday, June 3, the U.S. released its May ISM Manufacturing PMI, with the 48.7 reading falling short of an expected 49.6 and the prior reading of 49.2.
On Tuesday, June 4, the U.S. Job Openings and Labor Turnover Summary (JOLTS) was released for April, with a job openings level of 8,059,000. This was short of the forecast of 8,355,000.
On Wednesday, June 5, another U.S. release came in the form of the May ADP National Employment Report, with the 152,000 jobs added also falling short of the expected 175,000. However, the U.S. ISM Non-Manufacturing PMI (composite) showed a reading of 53.8 versus a forecast of 50.3, exceeding expectations.
As for the euro, on Thursday, April 6, the ECB's policy rate announcement was a reduction from 4.50% to 4.25%, as previously expected.
Furthermore, on Friday, July 7, finalized GDP was released for the euro. Both quarter-on-quarter and year-on-year data were in line with expectations.
Later on the same day, the U.S. May jobs report was released.
It revealed that month on month, nonfarm payrolls increased by 272,000 jobs, beating the expected 185,000 jobs by a wide margin. However, the unemployment rate increased from 3.9% to 4.0%.
Meanwhile, average hourly wages rose 0.4% month on month, versus a rate of 0.3% from the previous month. Year on year, the wage increase was 4.1% versus the previous 3.9% rate.
Economic Indicators and Statements to Watch this Week
(All times are in GMT)
June 9 (Sun)
23:50, Japan: January-March quarterly real gross domestic product (revised GDP, quarter-on-quarter data)
23:50, Japan: January-March quarterly real gross domestic product (revised GDP, annualized data)
June 12 (Wed)
06:00, U.K.: April monthly gross domestic product (GDP, month-on-month data)
12:30, U.S.: May Consumer Price Index (CPI, month-on-month data)
12:30, U.S.: May Consumer Price Index (CPI, year-on-year data)
12:30, U.S.: May Consumer Price Index (CPI core index, month-on-month data)
12:30, U.S.: May Consumer Price Index (CPI core index, year-on-year data)
18:00, U.S.: Federal Reserve Open Market Committee (FOMC) meeting, post-meeting policy rate announcement
18:30, U.S.: Regular press conference by Federal Reserve Chairman Jerome Powell
June 14 (Fri)
Japan: Bank of Japan Monetary Policy Meeting, post-meeting policy rate announcement
06:30, Japan: Regular press conference by Bank of Japan Governor Kazuo Ueda
Lined up this week are a series of interest rate related events for Japan and the U.S. Policy rates elsewhere have already been cut last week, as mentioned previously in Europe, but also in Canada. Switzerland and Sweden have already cut rates in March and May respectively, and we are beginning to see a change in the winds from the era of high interest rates to combat high inflation since 2022.
While it is unlikely that Japanese and U.S. interest rates will move immediately this week, market participants are keenly focused on statements and data. This means even a glimmer of information could stimulate an anxious fluctuation in currency pairs.
Furthermore, since Wednesday's CPI release will be the most important indicator determining the level of U.S. inflation, it is possible that the market may not move much on Monday and Tuesday.
This Week's Forecast
The following currency pair charts are analyzed using an overlay of the ±1 and ±2 standard deviation Bollinger Bands, with a period of 20 days.
USDJPY
Since the CPI, FOMC meeting, and BOJ monetary policy meeting are all economic events involving the dollar and the yen, there are potential scenarios that could drive extreme volatility in currency markets. In addition, extreme volatility can easily lead to temporarily wider spreads and slippage, meaning that casually setting positions could result in severe harm.
Next is an analysis of the USDJPY daily chart.
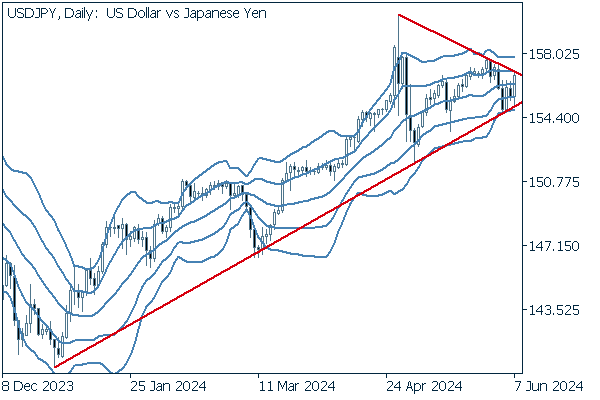

The pair is currently neatly folded within the lower support line drawn from the latest New Year low and the upper resistance line drawn from the Japanese Golden Week vacation period high. It would appear that the pair finds itself in a key phase not only fundamentally but also technically.
We continue with an analysis of the USDJPY weekly chart.
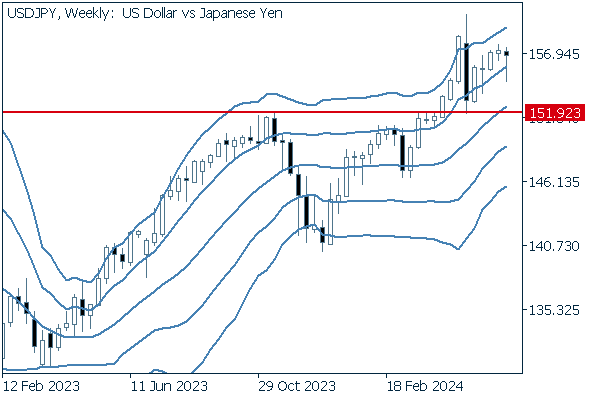

The pair's decline in the first half of the week temporarily sent it below the +1 standard deviation Bollinger Band, but then reversed course to close above this band. Though highly turbulent, the chart suggests an upward bandwalk.
EURUSD
Despite a rate cut in the euro, this was not immediately reflected in price movements. However, interest rate differentials are always present and affect price movements, and can change the future course of the market.
In addition, while the euro and dollar do not yet have a wide interest rate differential, there is a good chance that this could be a long-term sea change for yen crosses like the EURJPY.
Next is an analysis of the EURUSD daily chart.
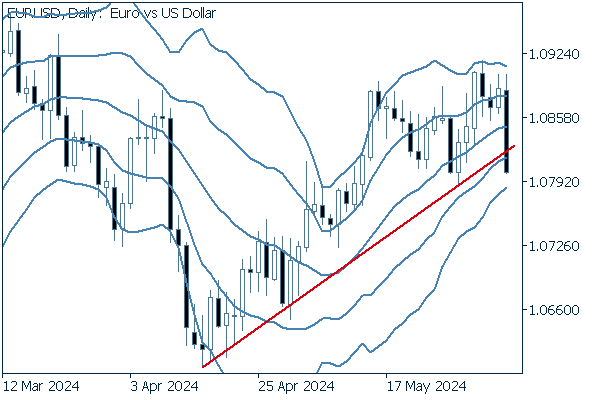

It looks as if the pair may have broken below the lower support line at close. The band width in the upper and lower Bollinger Bands may offer hints about volatility changes.
We continue with an analysis of the EURUSD weekly chart.
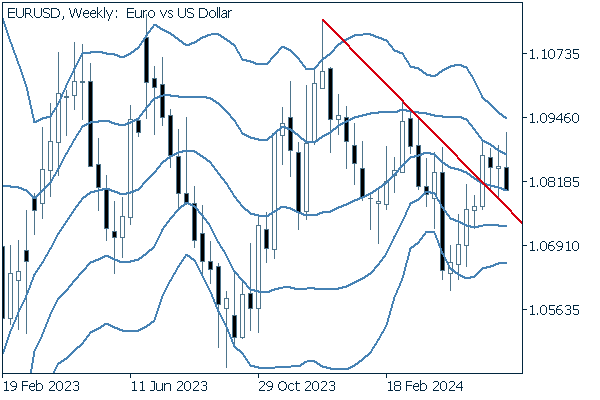

On a weekly basis, it appears that the pair is determined to stay above its most recent resistance line. Maintain focus on the current points and observe; a break either upward or downward will result in longer candles and expanded Bollinger Bands.
GBPUSD
If we line up charts from the EURUSD and GBPUSD with those of the EURJPY and the GBPJPY, we can easily see that the geopolitically proximate euro and pound also show quite similar price movements.
With the euro having made its first rate cut, a case can be made that the pound will eventually follow suit.
Now, we analyze the daily GBPUSD chart.
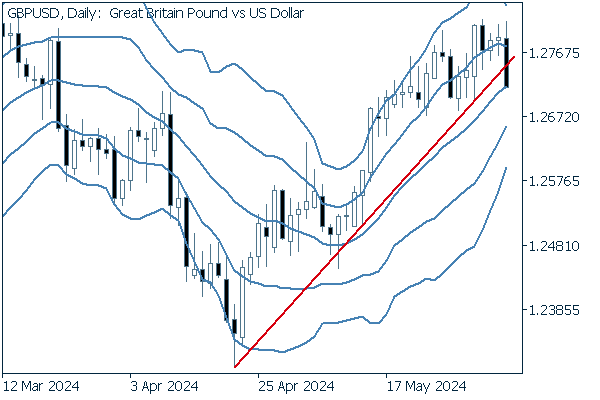

Like the EURUSD, it appears that the pair may have broken below its lower support line. If the middle line follows behind and also breaks below, there may be a case for an acceleration of the downside.
We continue with an analysis of the GBPUSD weekly chart.
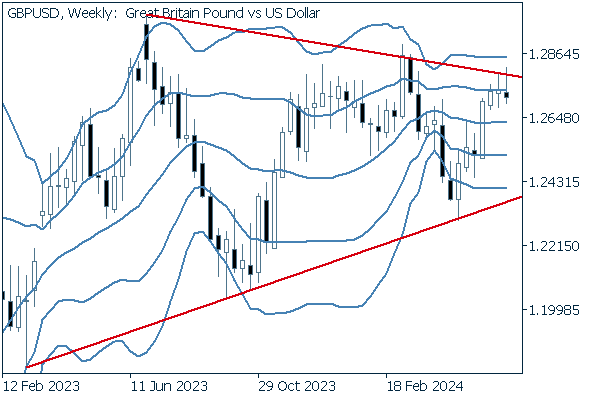

Looking out over the full year of trading, we can see that the pair is within a triangle formation. Within this context, the pair has been poised to break above the upper side of the triangle, and has failed to do so for two weeks in a row.
Was this article helpful?
0 out of 0 people found this article helpful.
Thank you for your feedback.
FXON uses cookies to enhance the functionality of the website and your experience on it. This website may also use cookies from third parties (advertisers, log analyzers, etc.) for the purpose of tracking your activities. Cookie Policy
