


#supportive
#mainchart
#supportive
#mainchart
Downloaded:
0
times
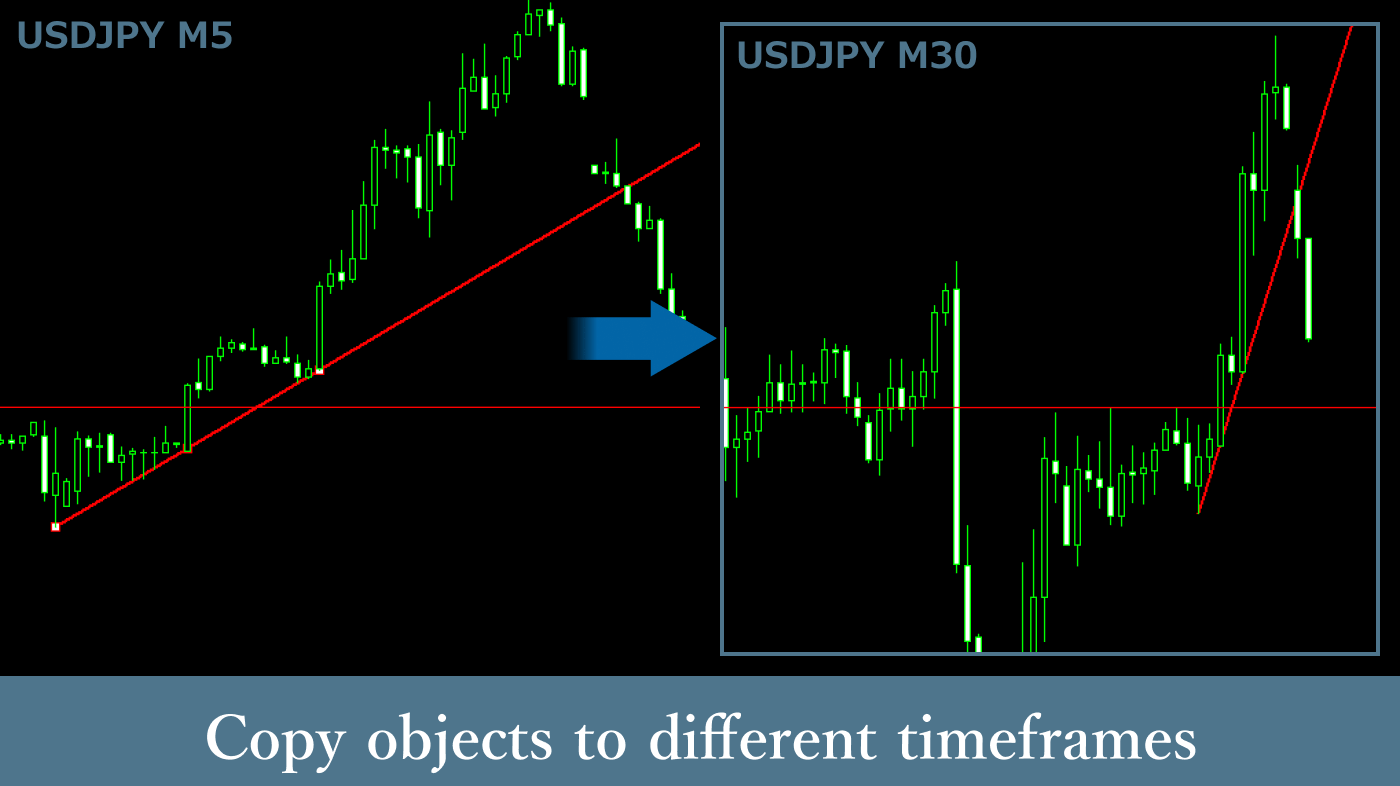
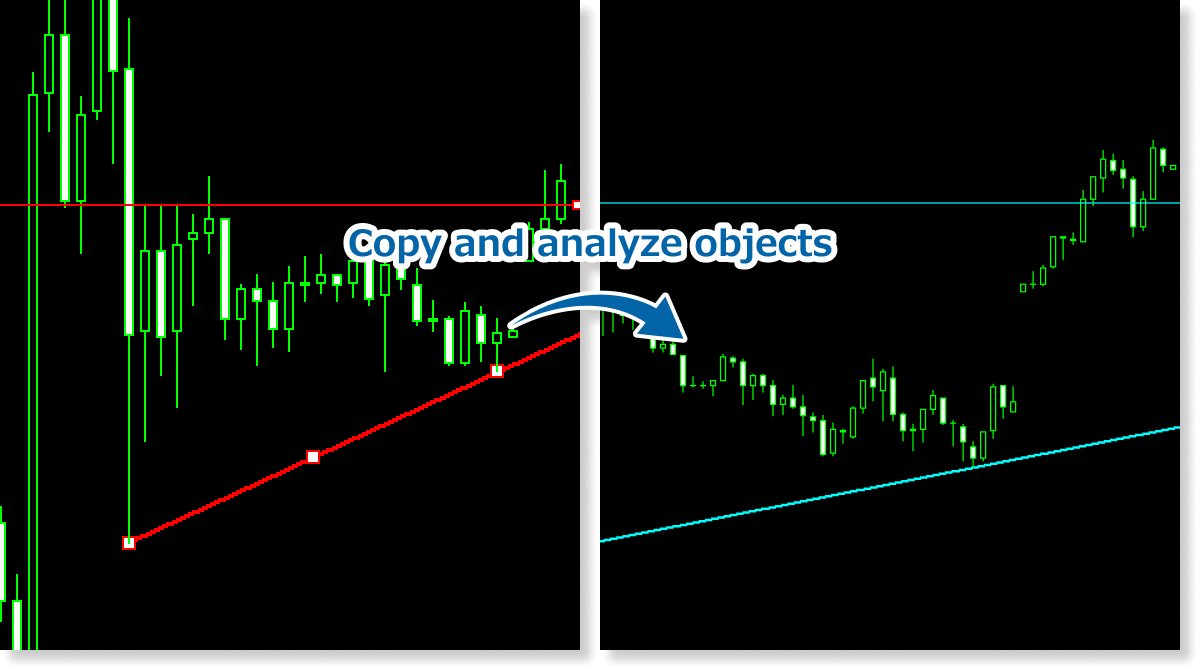
The Line Copy Indicator automatically copies objects, such as trend lines, drawn on charts to other windows with the same instruments. By synchronizing objects across different timeframes, it simplifies multi-timeframe analysis.*1
*1Some users are experiencing issues when running custom indicators on MT5 build 5572 (released around February 1, 2026), including display errors and platform freezing. These problems can be resolved either by downgrading to build 5430 (or any earlier build) or by updating to the beta version. The latest beta version is available from the MT5 toolbar by navigating to Help > Check For Updates > Latest Beta Version.
Downloaded:
0
times
Usage scenarios
Application to multi-timeframe analysis
It is possible to use this for multi-timeframe chart analysis by confirming support lines, resistance lines, and trend lines drawn to match patterns like double tops and double bottoms from higher timeframes in lower timeframes.
For trading timing decisions
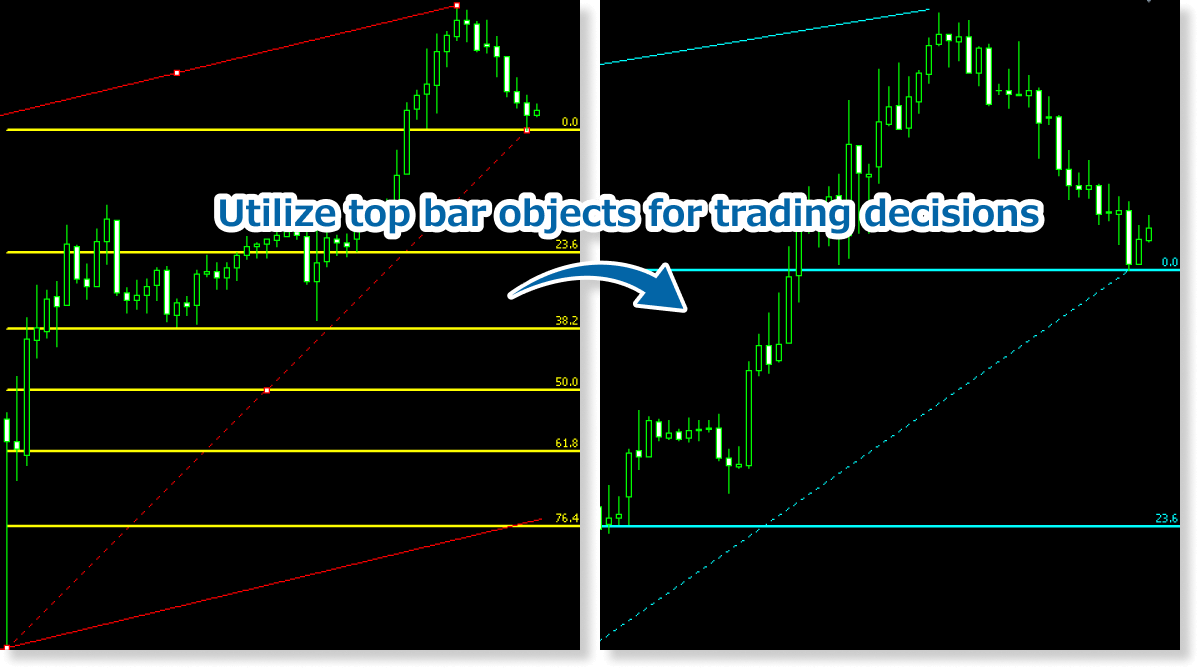
The Line Copy Indicator can also copy and display channel lines and Fibonacci retracements. It can be used to determine trading timing based on breakouts and rebounds.
Simultaneous confirmation of short, medium, and long-term indicators
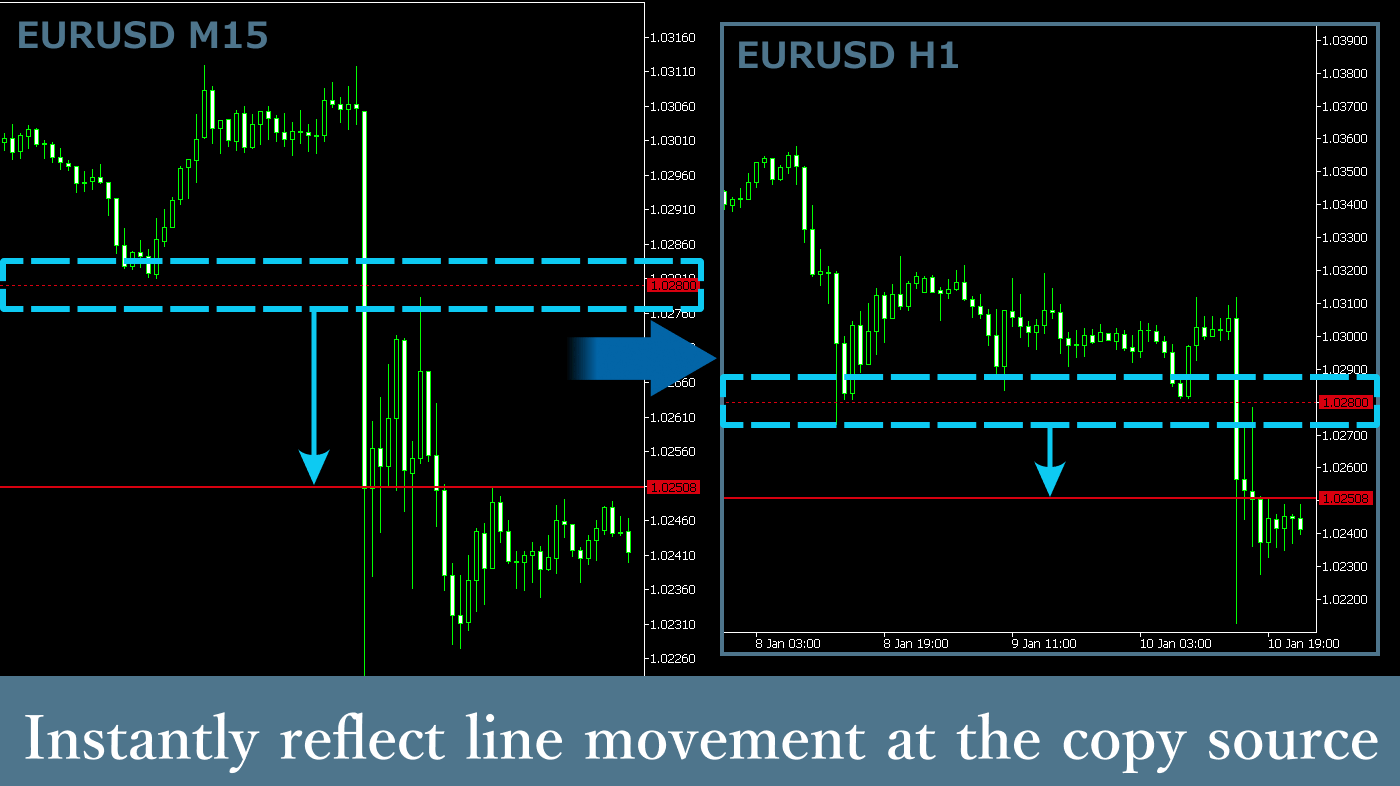
When monitoring long-term or medium-term trends on higher timeframe charts and modifying trend lines as needed, the Line Copy Indicator reflects these changes in real-time on lower timeframe charts.
By using technical indicators for determining trading timing on lower timeframe charts, you can conduct more accurate chart analysis and make trading timing decisions while being mindful of long-term trends, support lines, and resistance lines.
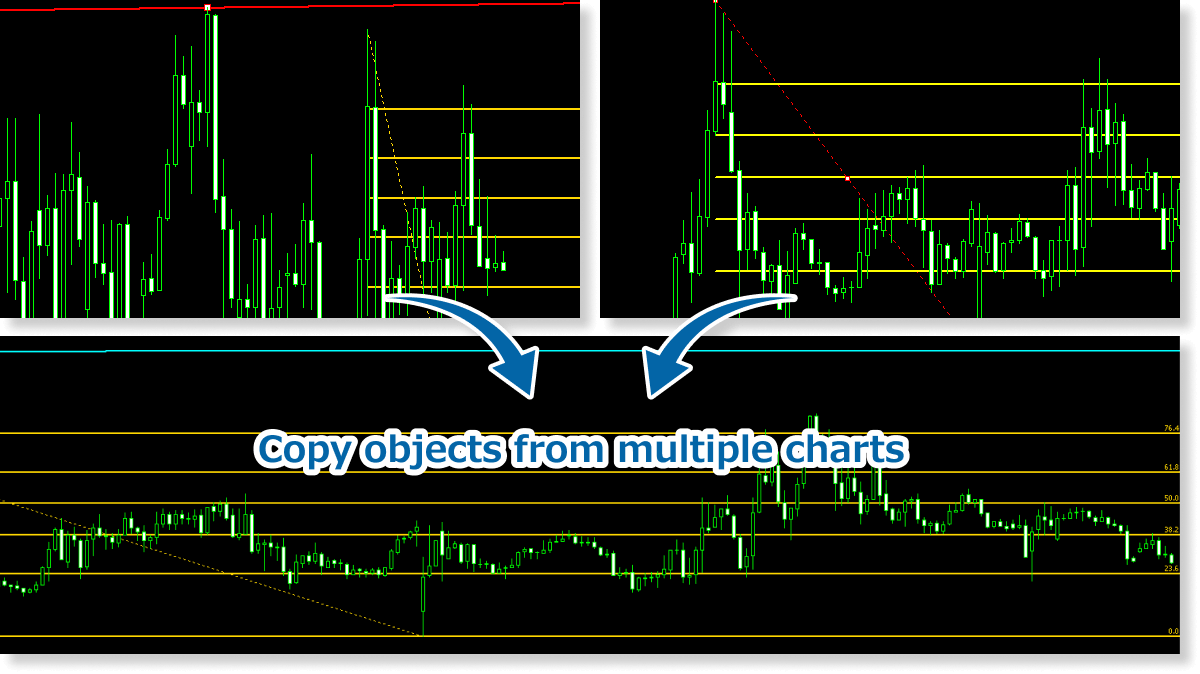
The Line Copy Indicator enables more accurate and efficient analysis across multiple windows, making it especially useful for traders who frequently perform multi-chart analysis.
Object edits or removals are synchronized only when changes are made on charts with the Line Copy Indicator applied. Updates on charts without the indicator will not affect other charts. To enable two-way synchronization, apply the indicator to all relevant charts.
How to install
To use the Line Copy Indicator, follow the steps below to download and install it.
Step 1
Click the button below to download the indicator for MT4/MT5.
Step 2
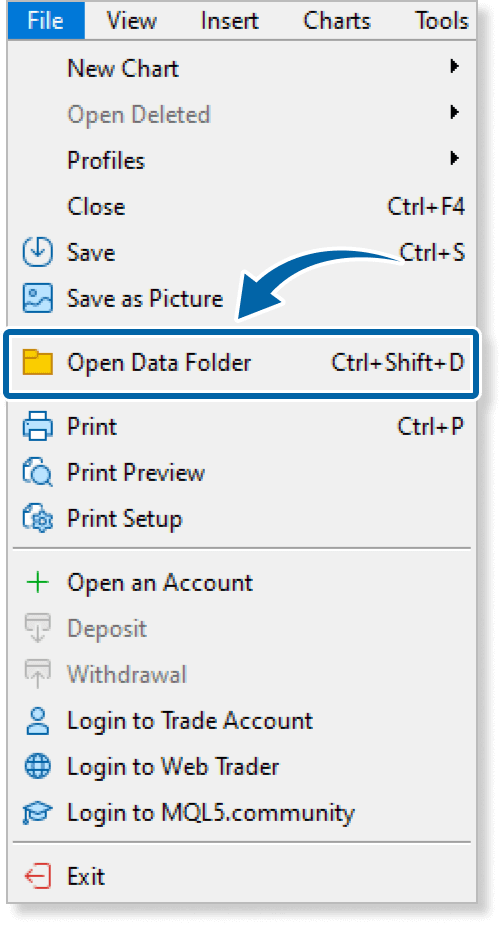
Click File > Open Data Folder in the top menu of MT4/MT5.
Step 3
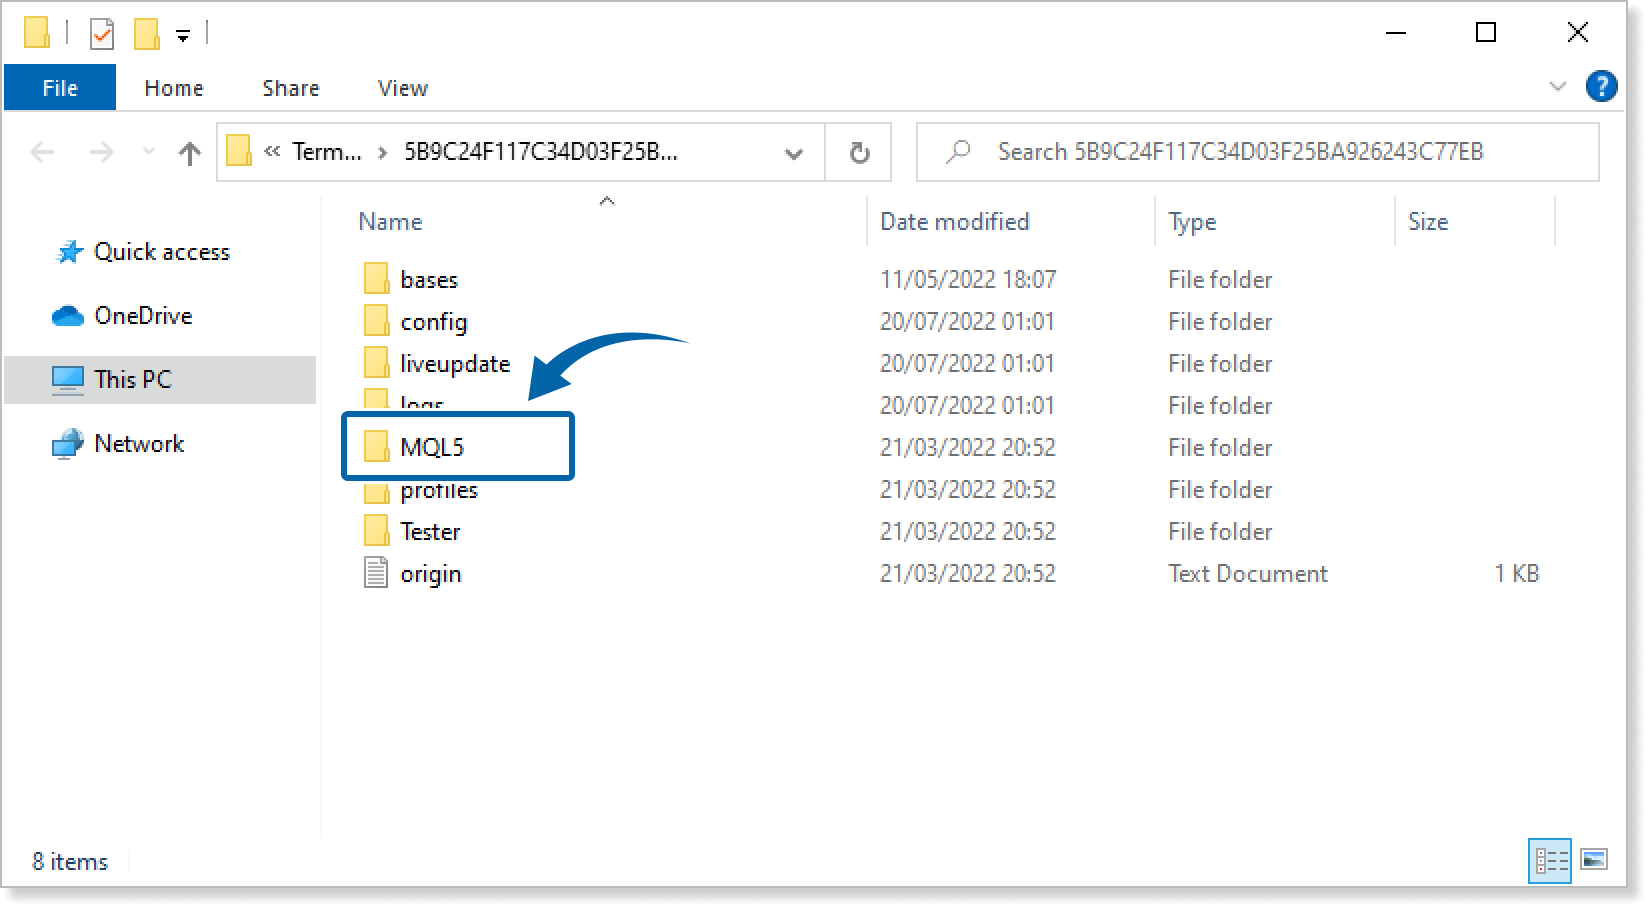
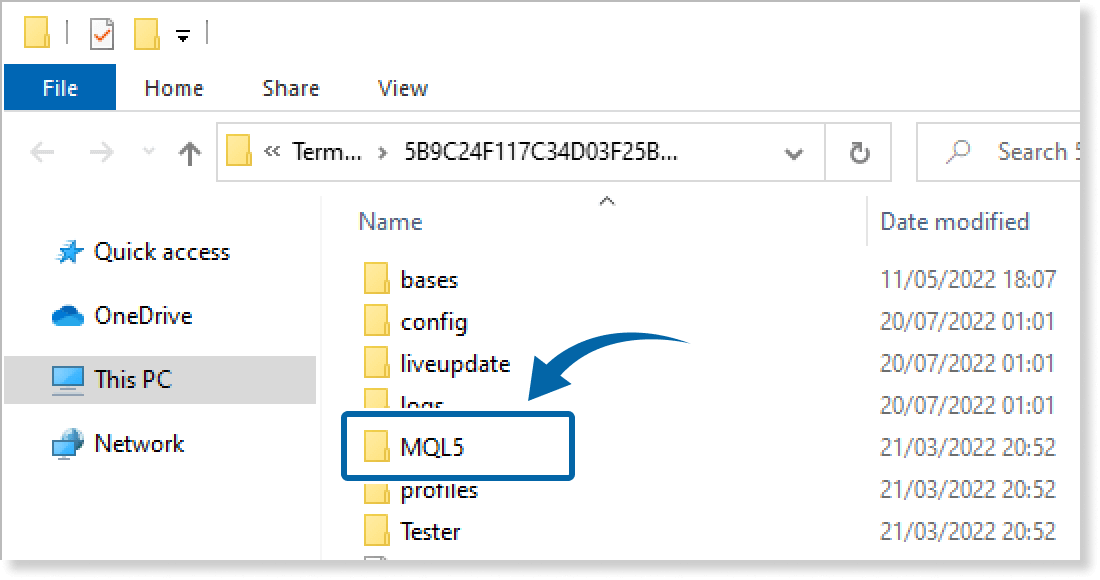
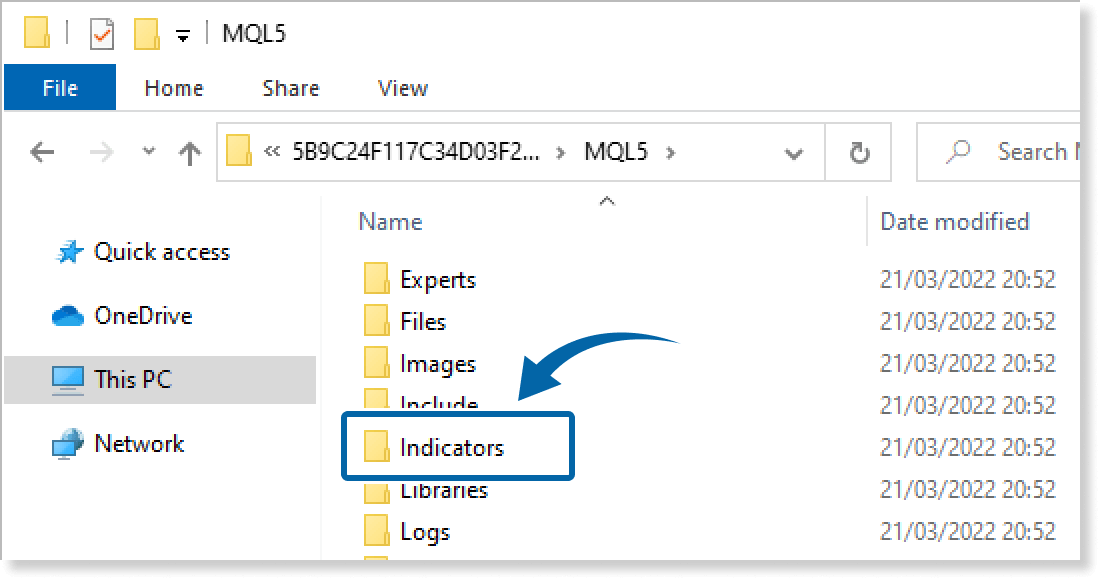
In the data folder, double-click the MQL4 or MQL5 folder.
Step 4
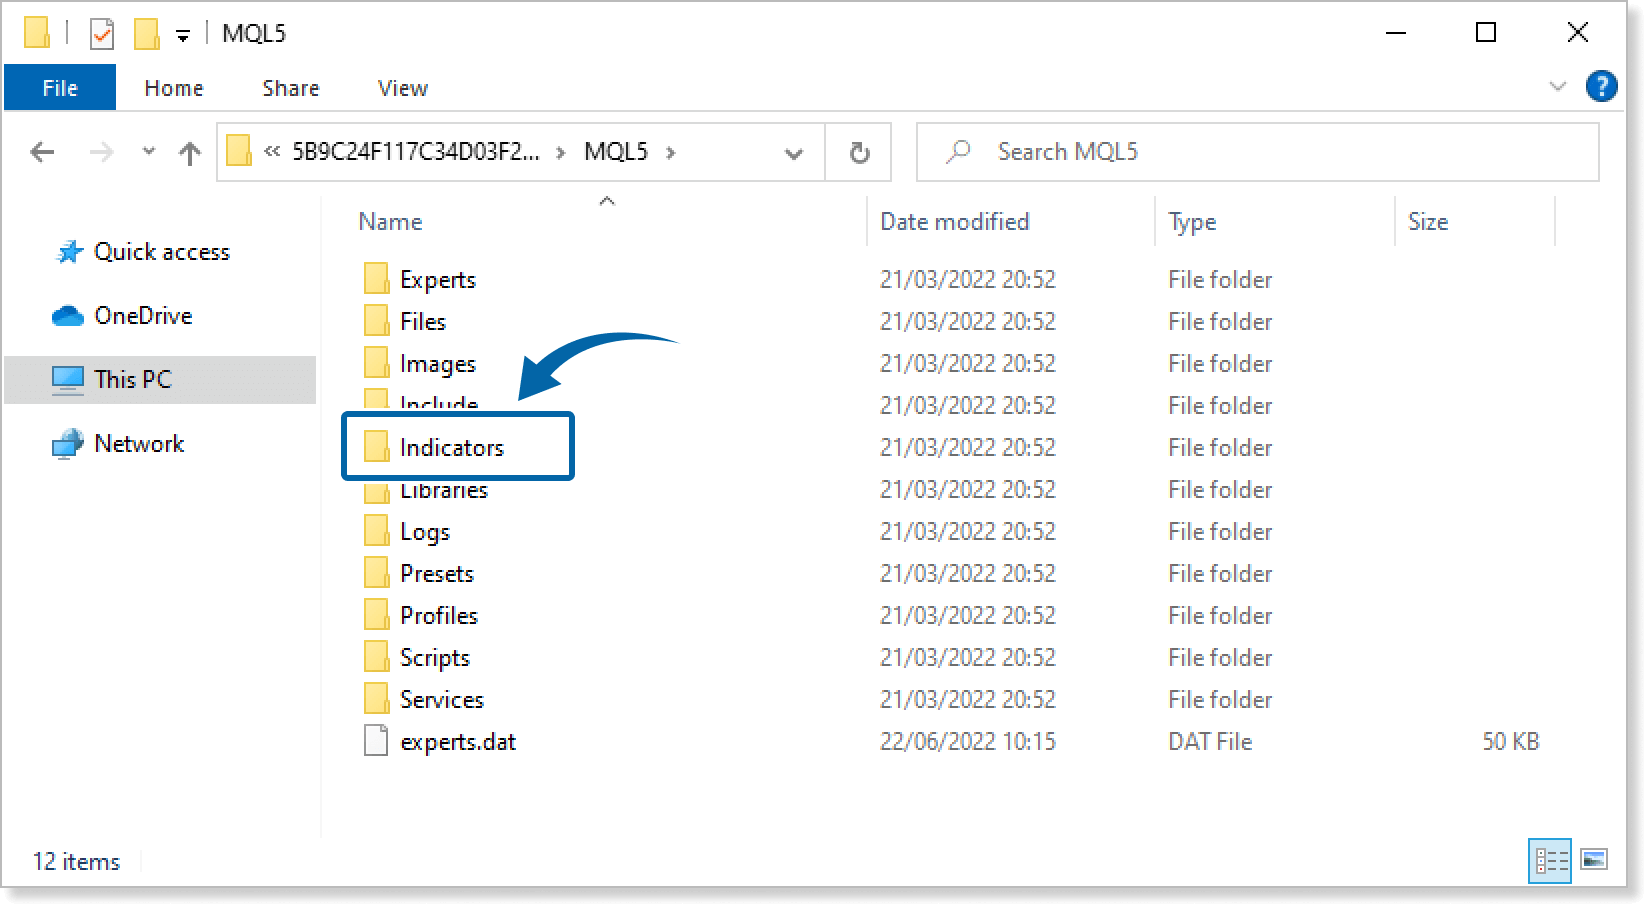
In the MQL4/MQL5 folder, double-click the Indicators folder.
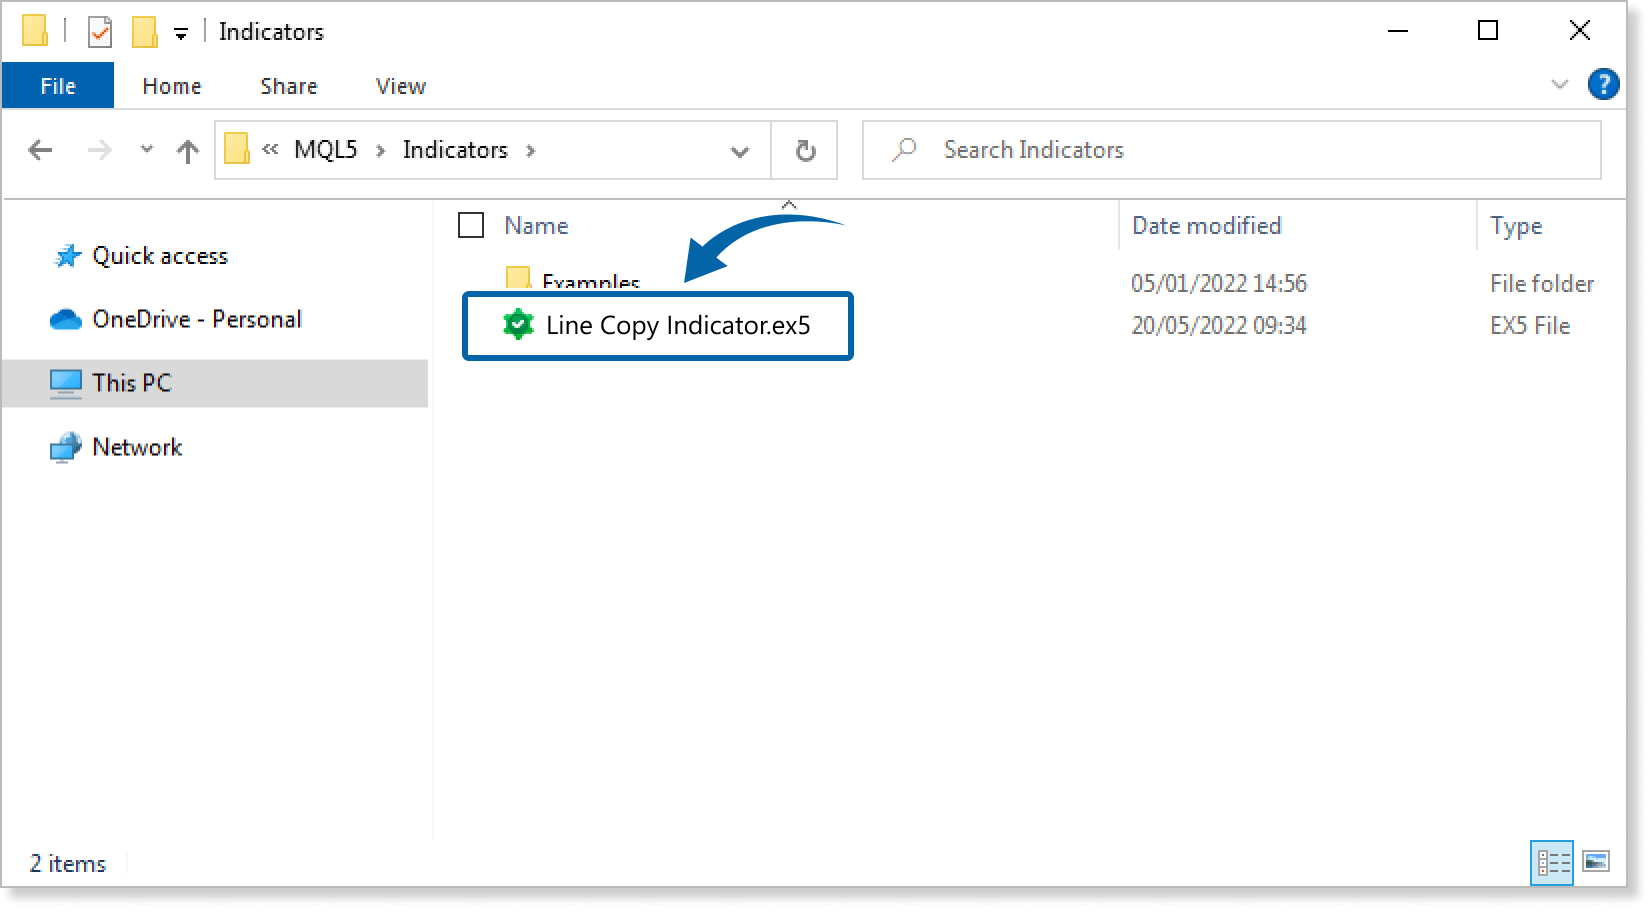
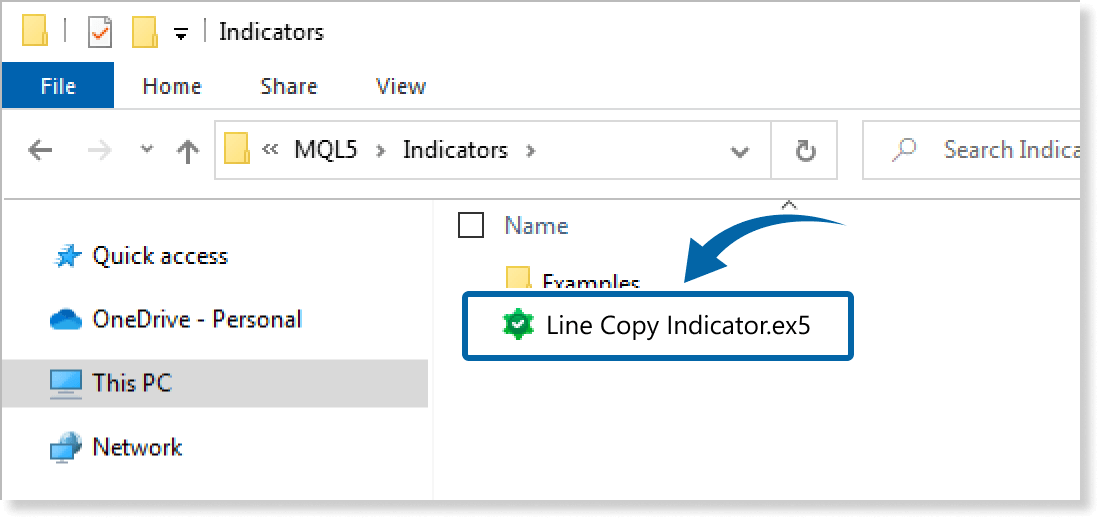
Step 5
Save the Line Copy Indicator in the Indicators folder.
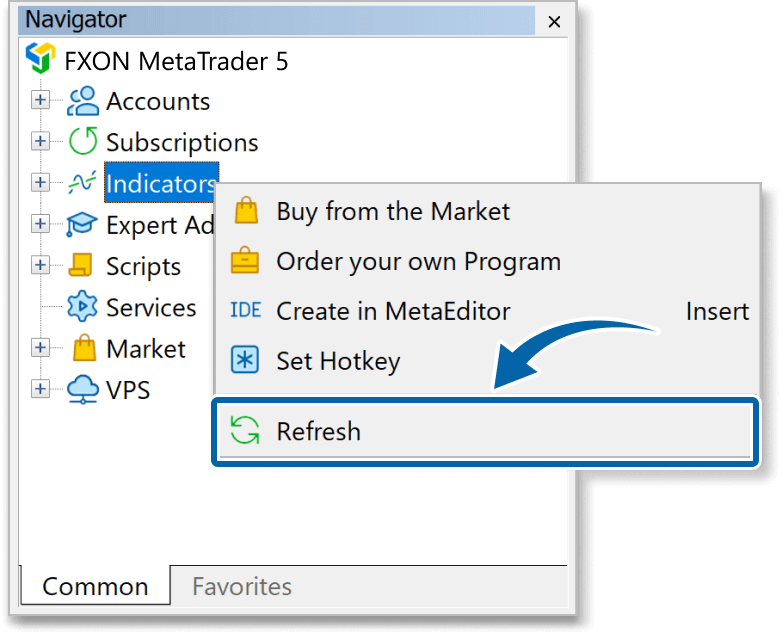
Step 6
Go back to the MT4/MT5. Right-click Indicators in the Navigator, and click Refresh.
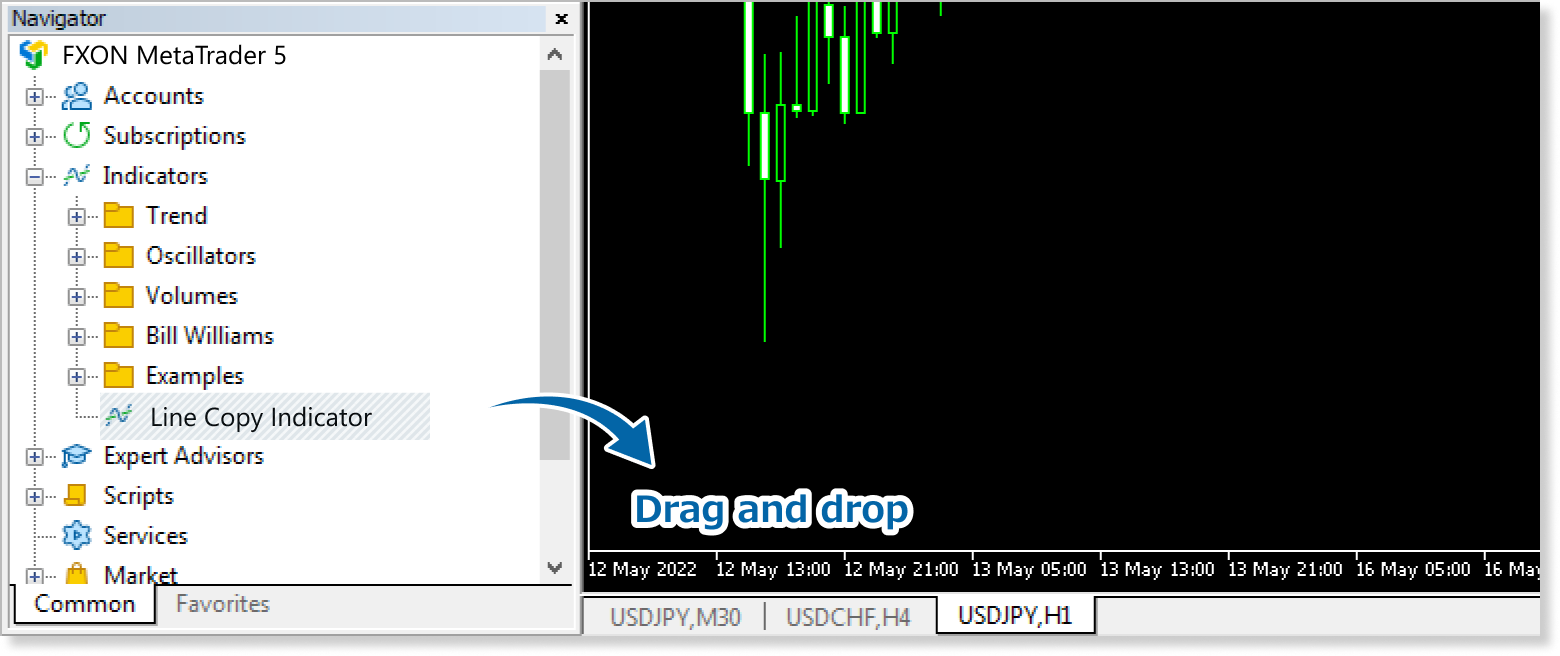
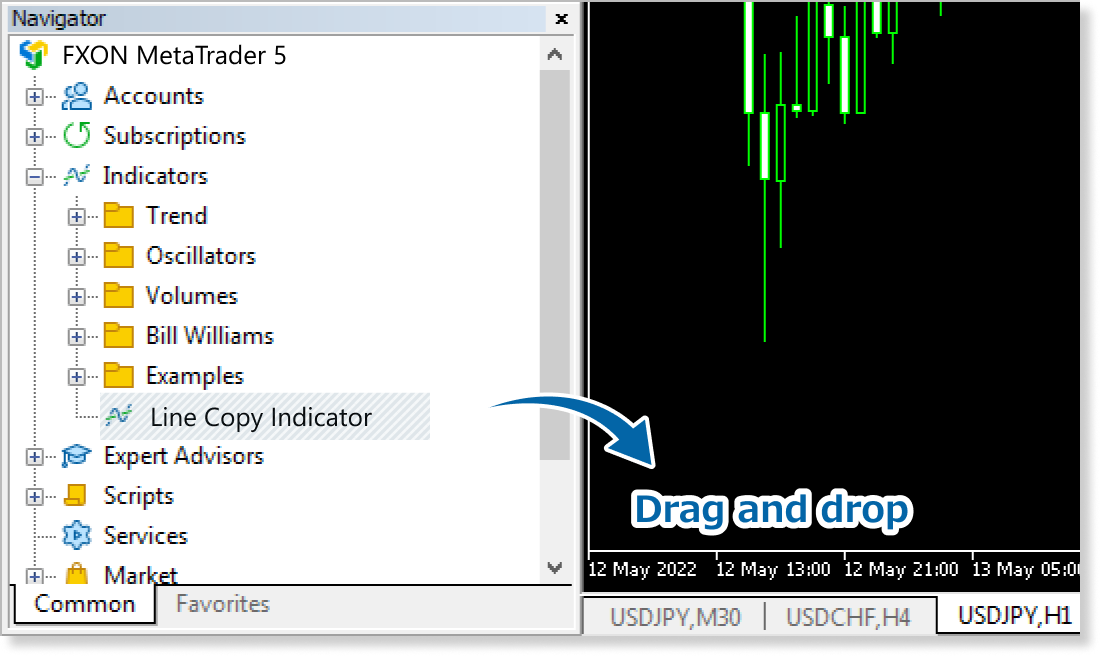
Step 7
In the Navigator, click the + icon next to Indicators. Find the Line Copy Indicator, then either double-click it or drag it onto a chart.
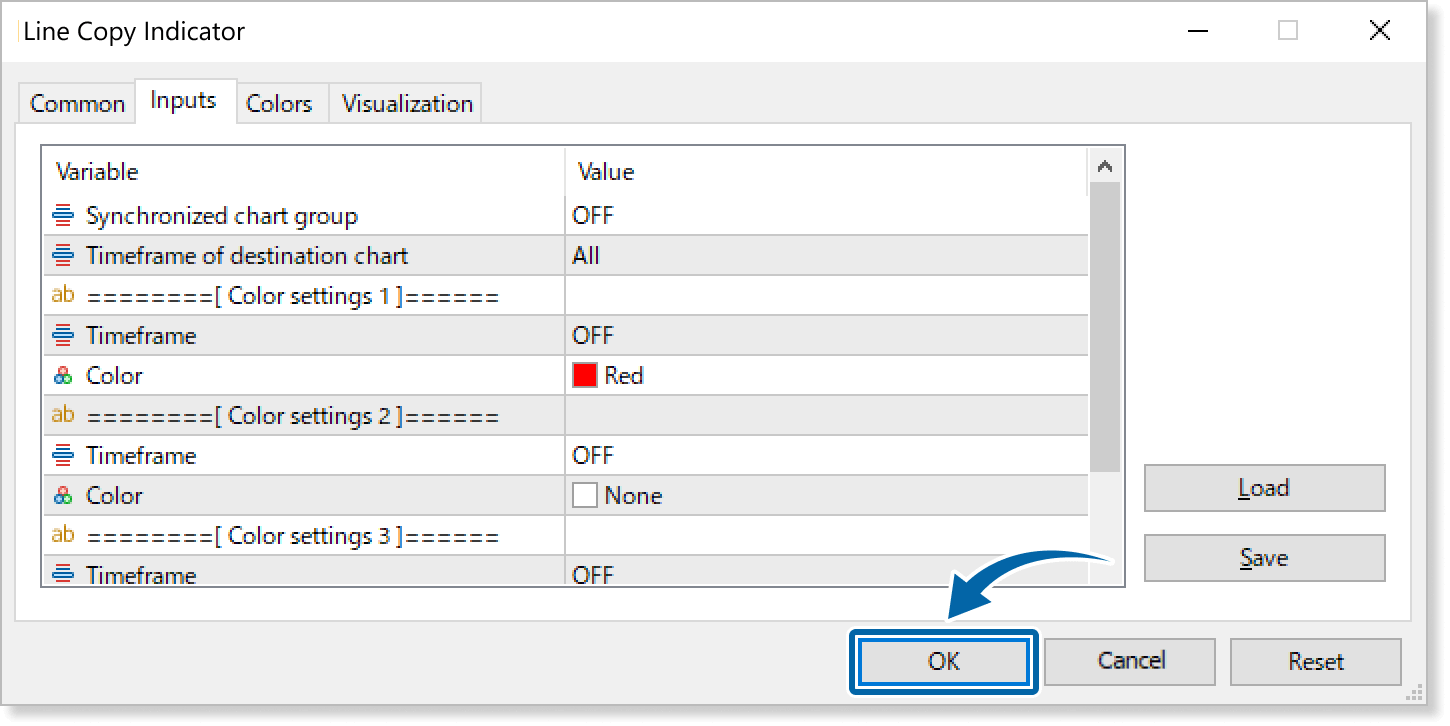
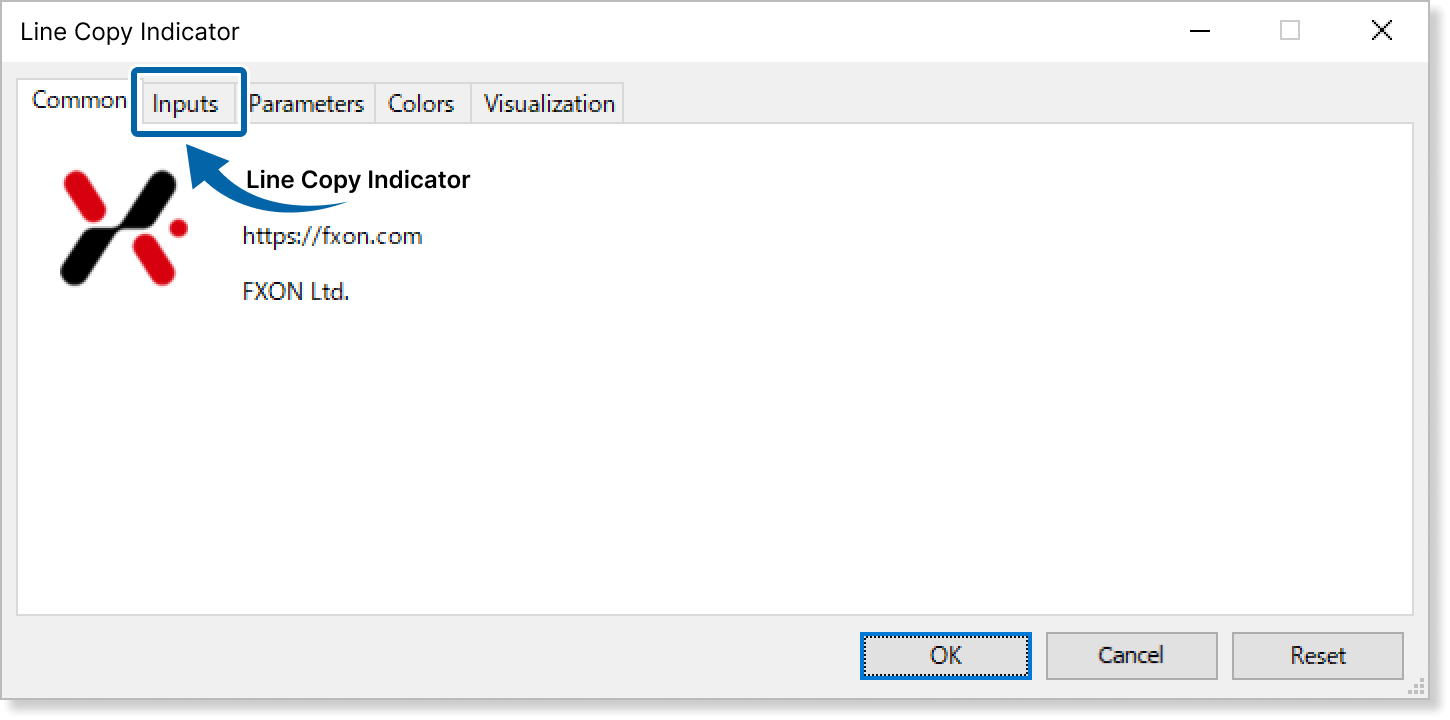
Step 8
In the indicator settings window, customize the settings on the Inputs tab according to the How to set up page, then click OK.
Step 9
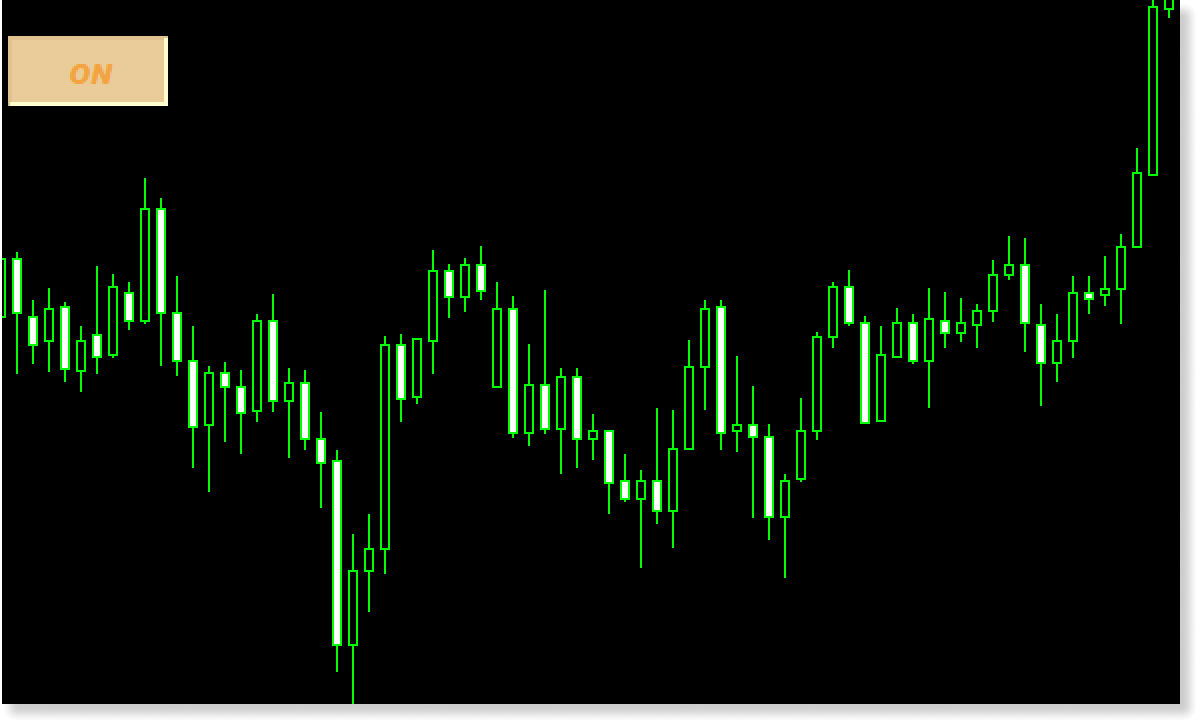
The Line Copy Indicator will be applied to the chart, displaying a toggle button for line copying.
How to set up
After applying the indicator to the chart, set the parameters according to your style.
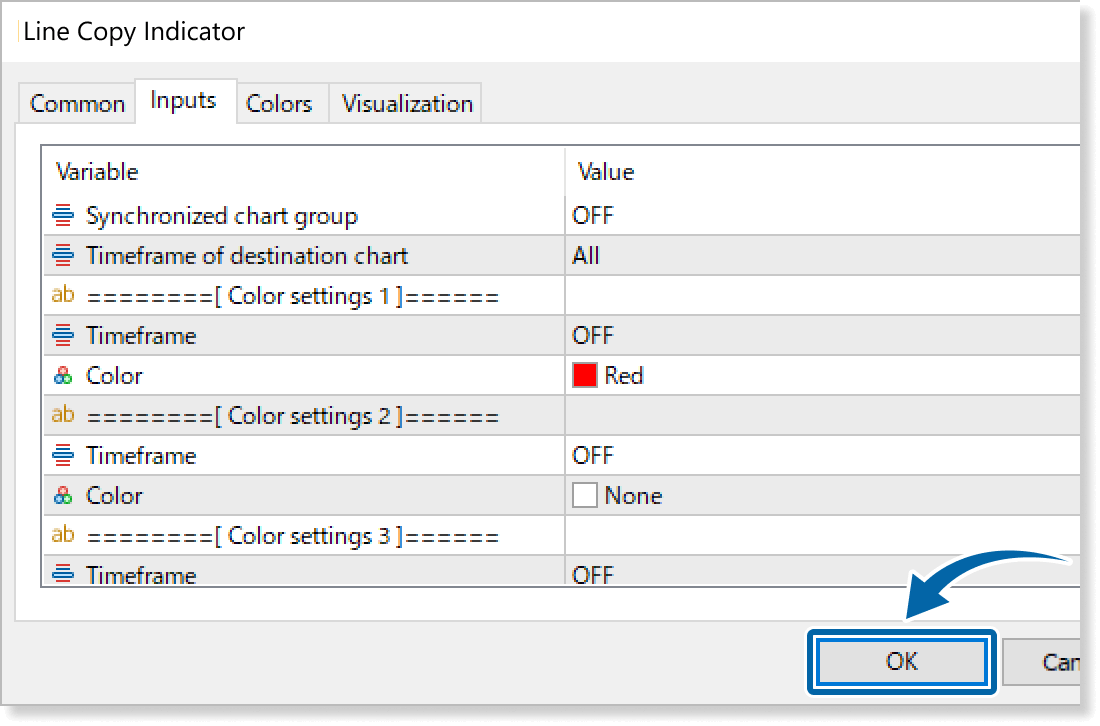
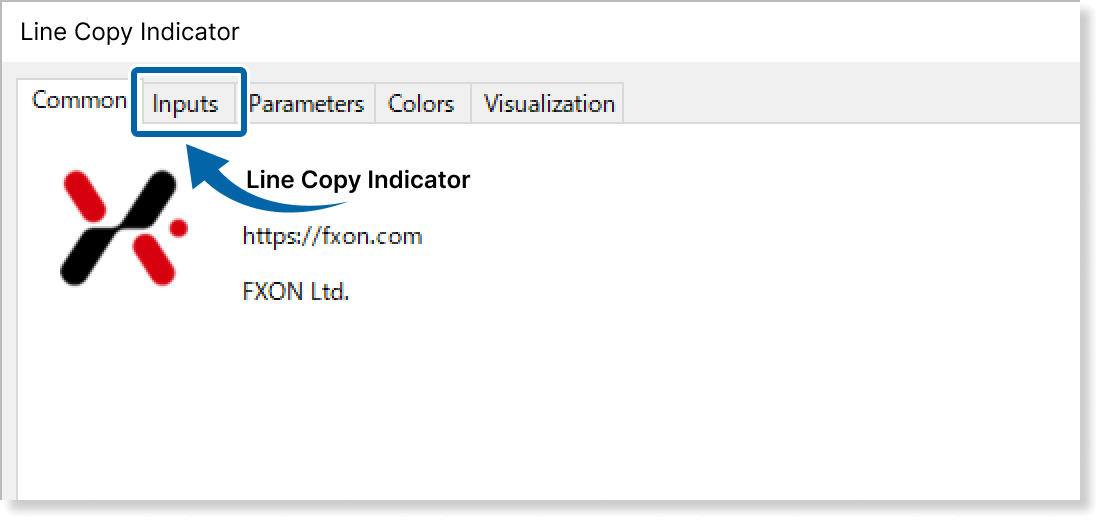
Step 1
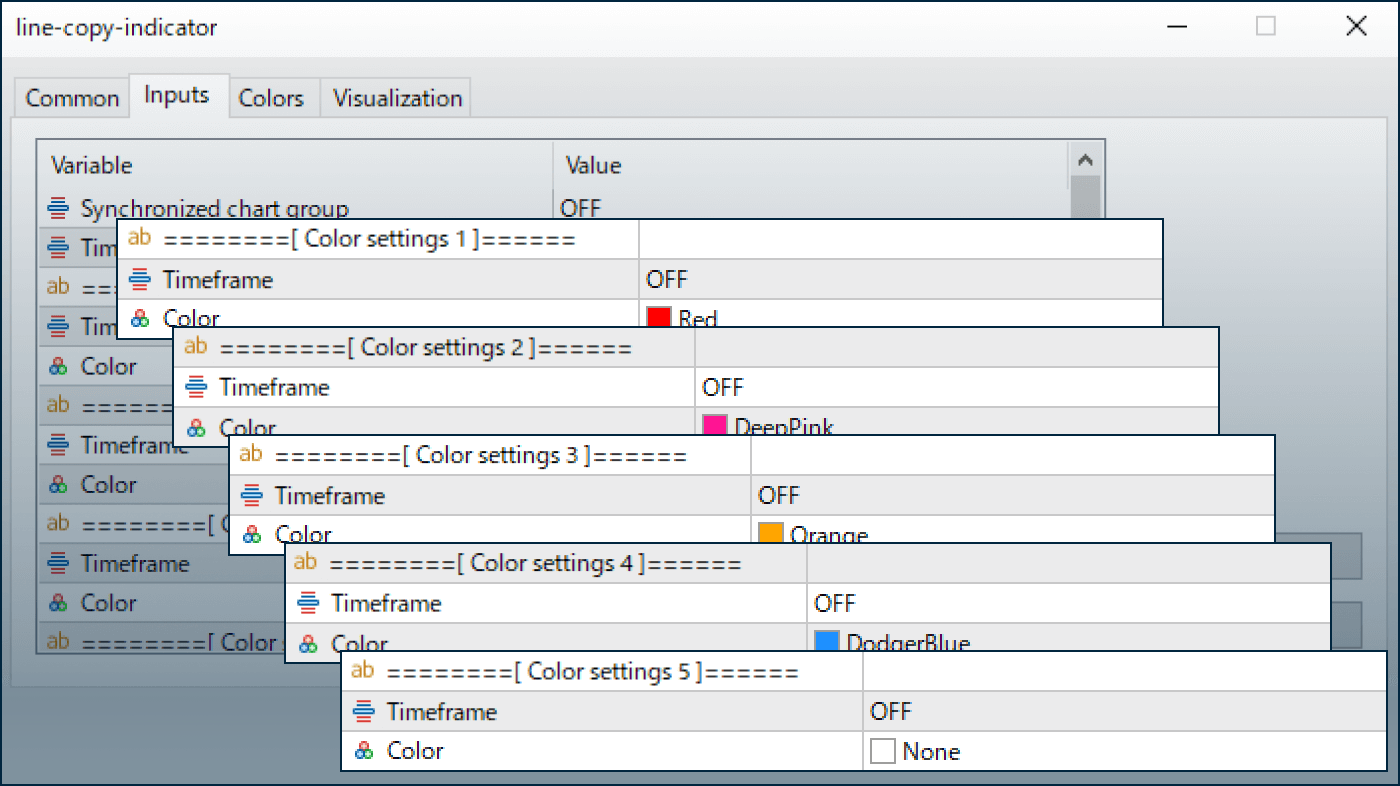
First, open the Inputs tab.
Step 2
Set the parameters as follows.
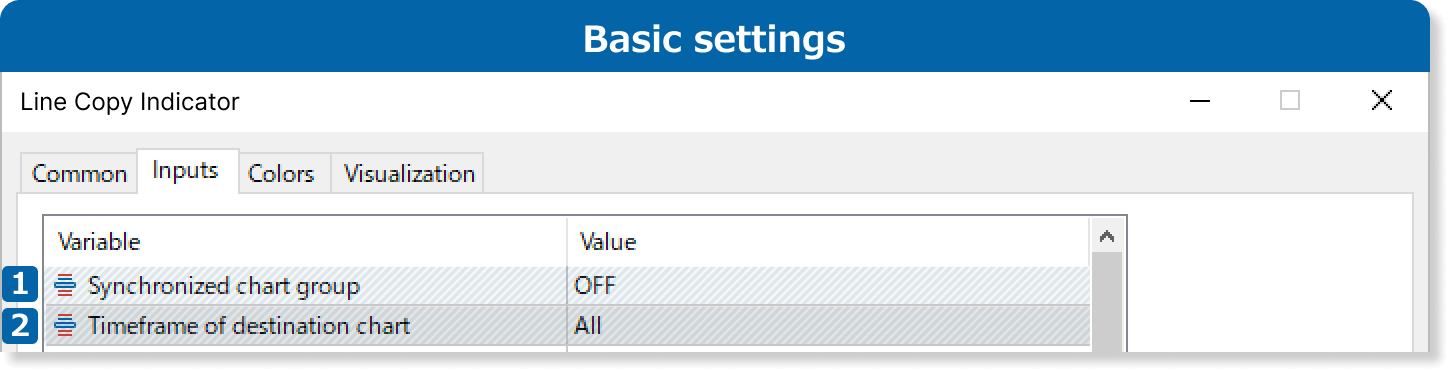
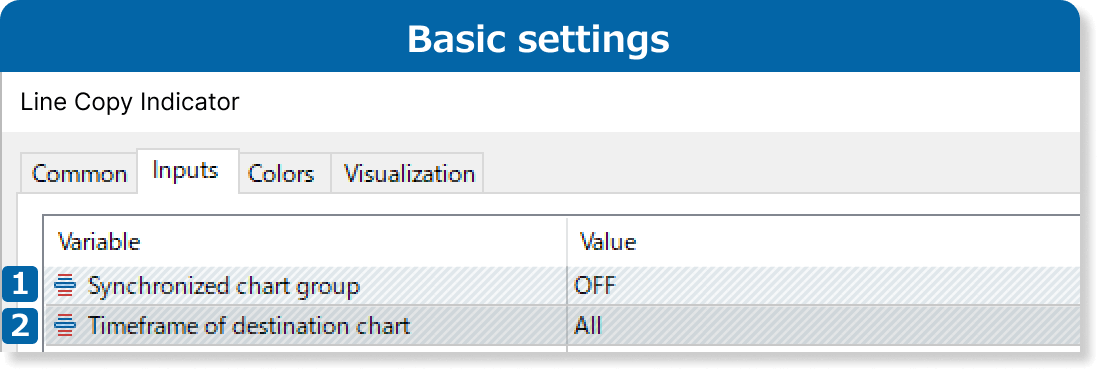
①Synchronized chart group
Set the chart symbol to synchronize.
OFF: Copies objects to charts of the same symbol as the chart where this indicator is applied.
A/B/C: Copies objects to charts with Line Copy Indicators set to the same letter.
②Timeframe of destination chart
Select the destination timeframe from "All," "Higher timeframe," or "Lower timeframe."
All: Objects are copied regardless of timeframe.
Higher timeframe: Lines are copied only to timeframes higher than the one where the indicator is applied.
Lower timeframe: Objects are copied only to timeframes lower than the one where the indicator is applied.
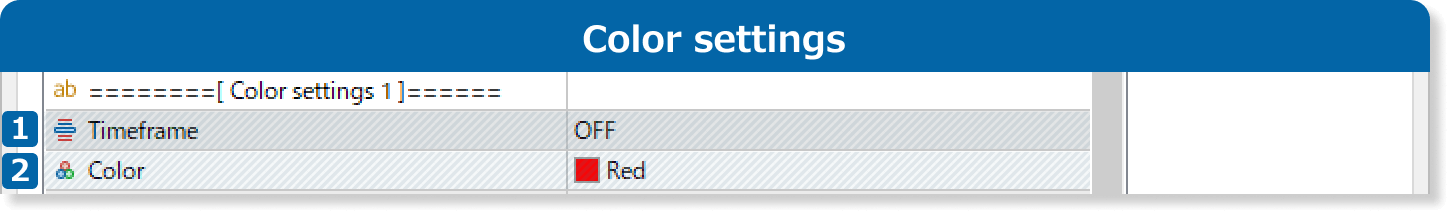
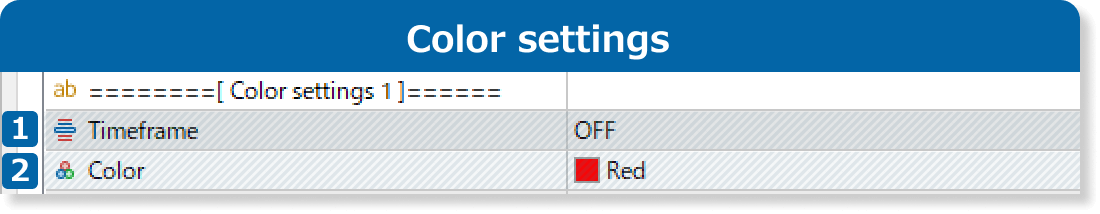
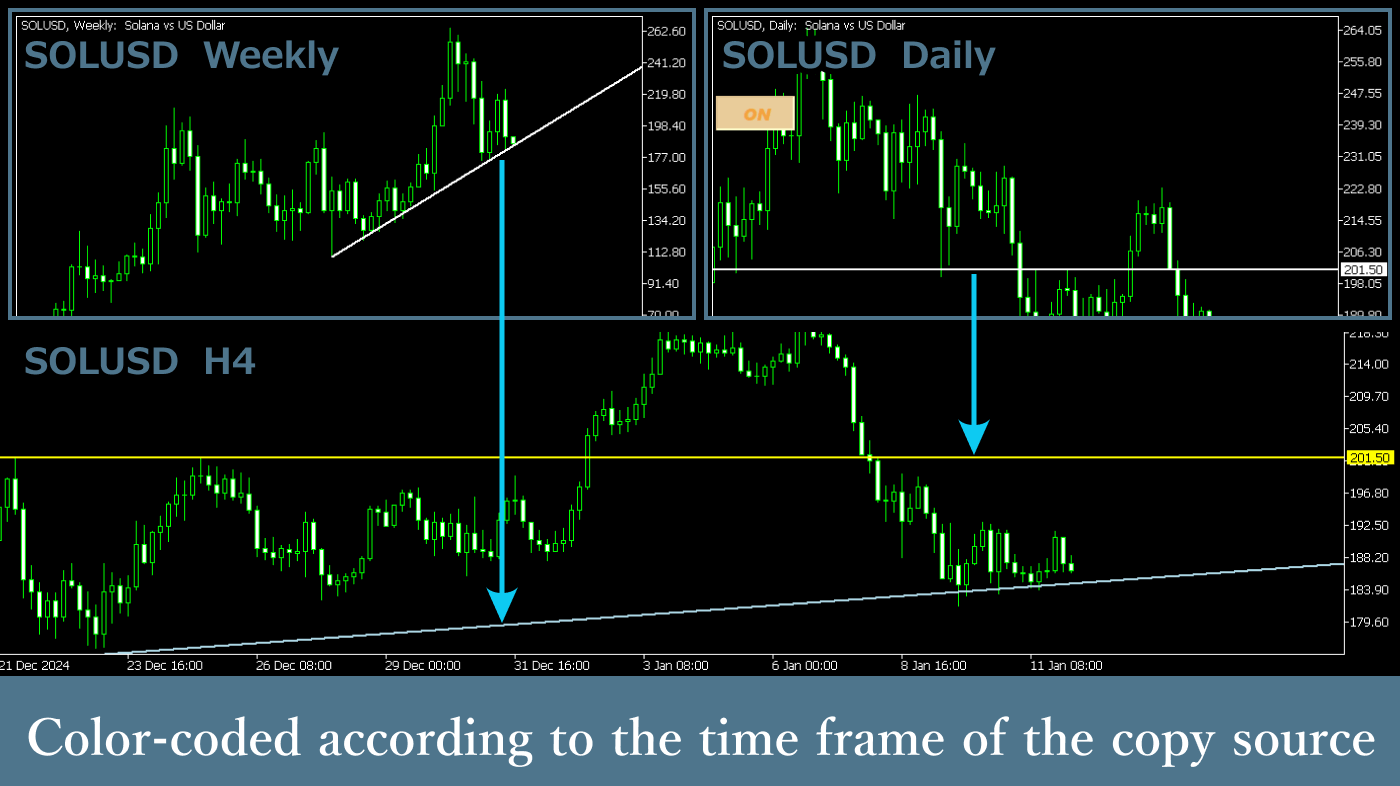
①Timeframe
Select the timeframe to use for color setting.
②Color
Select the object color to use for color setting.