#technical
#mainchart
#technical
#mainchart
Downloaded:
0
times
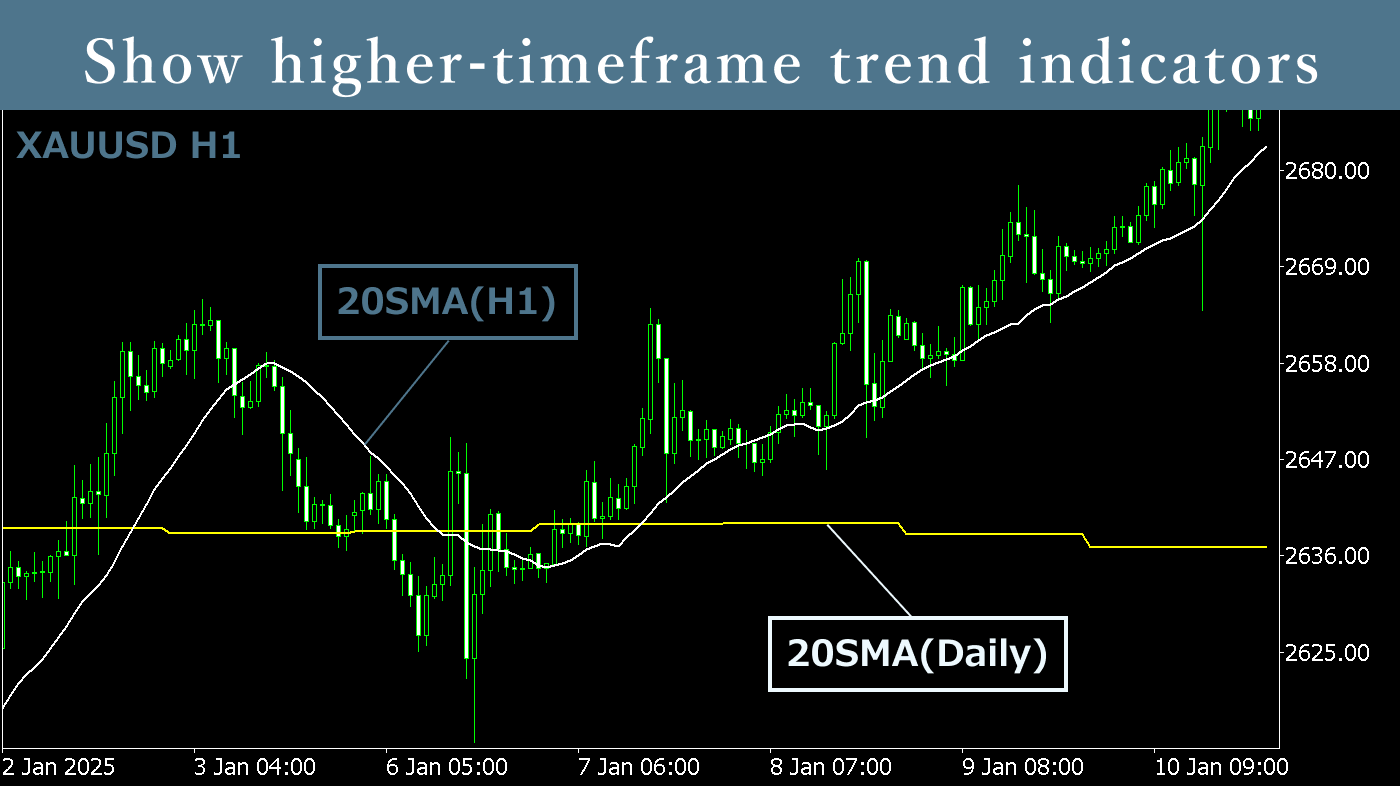
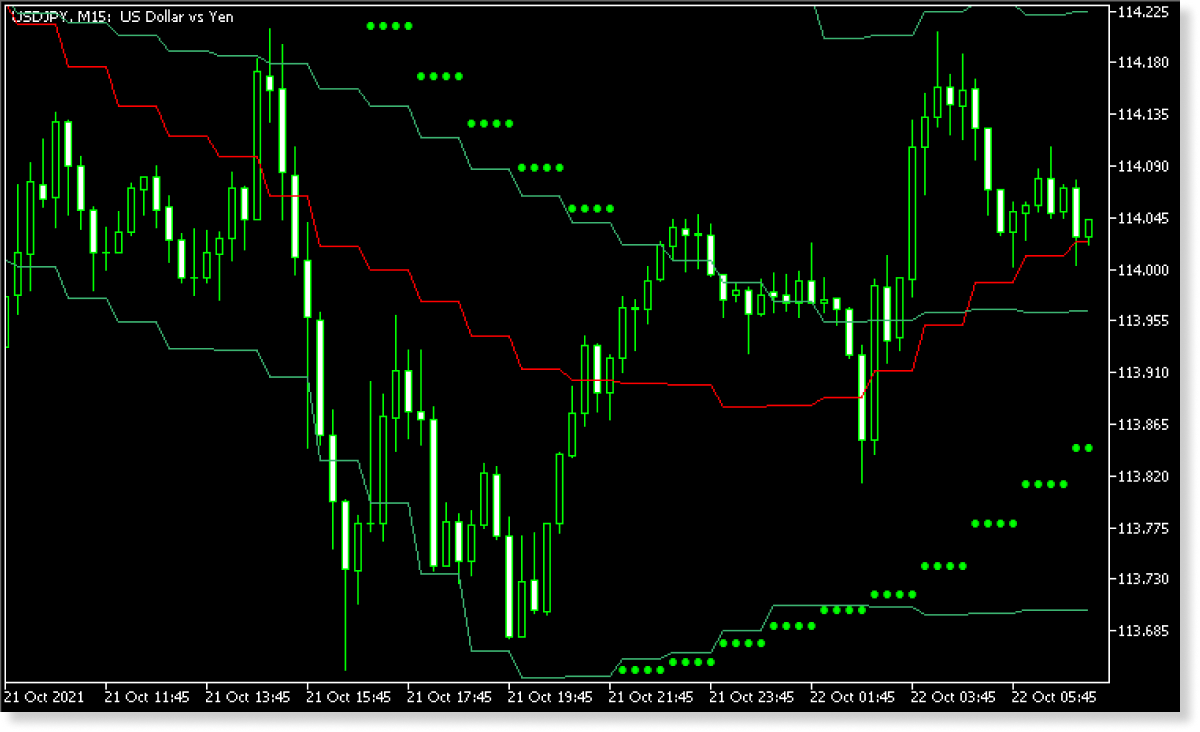
The Higher Timeframe Indicator (Trend Indicators) allows you to display moving averages, Parabolic SAR, and Bollinger Bands from the same or higher timeframes as the applied chart. By eliminating the need to switch between timeframes, it is particularly useful for observing long-term technical indicators to gauge market trends before making entry decisions on shorter timeframes.
Downloaded:
0
times
Usage scenarios
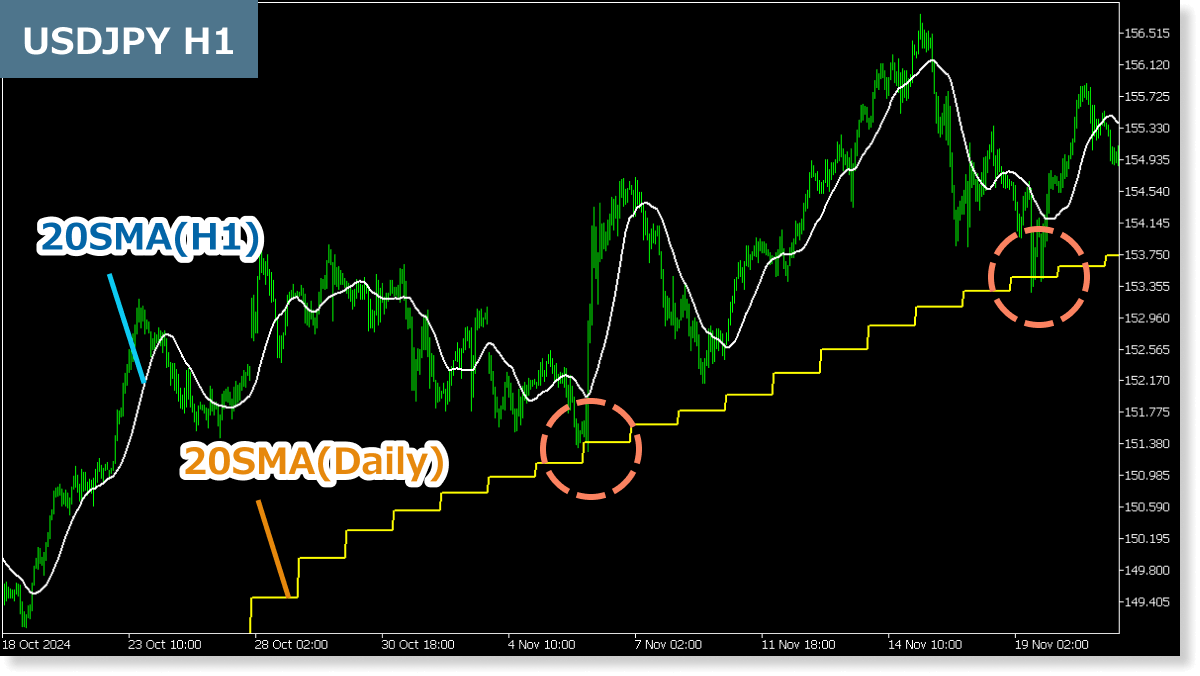
For finding entry opportunities
For example, by displaying the daily 20 SMA on a 1-hour chart, you can grasp the broader market trend and look for rebound or breakout opportunities. Utilizing the Higher Timeframe Indicator (Trend Indicators) helps you gain valuable insights for more precise entry points.
You can apply the indicator settings above by downloading the settings file from the button below and importing it.
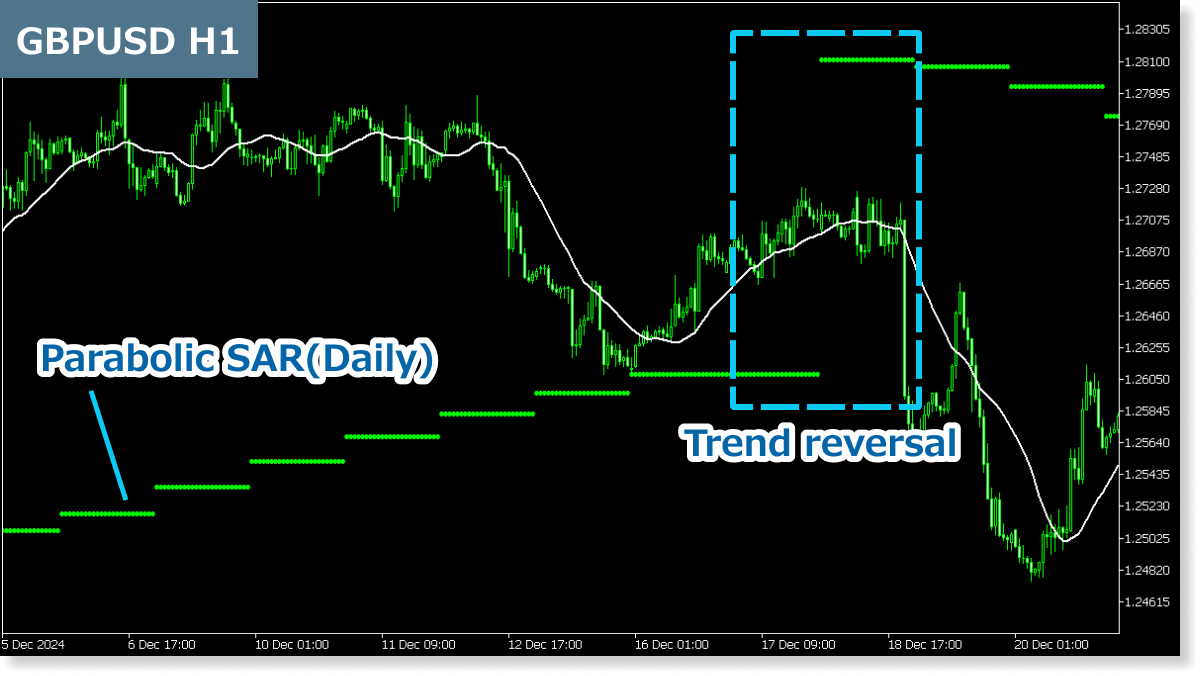
DownloadAssessing trend continuity or reversal
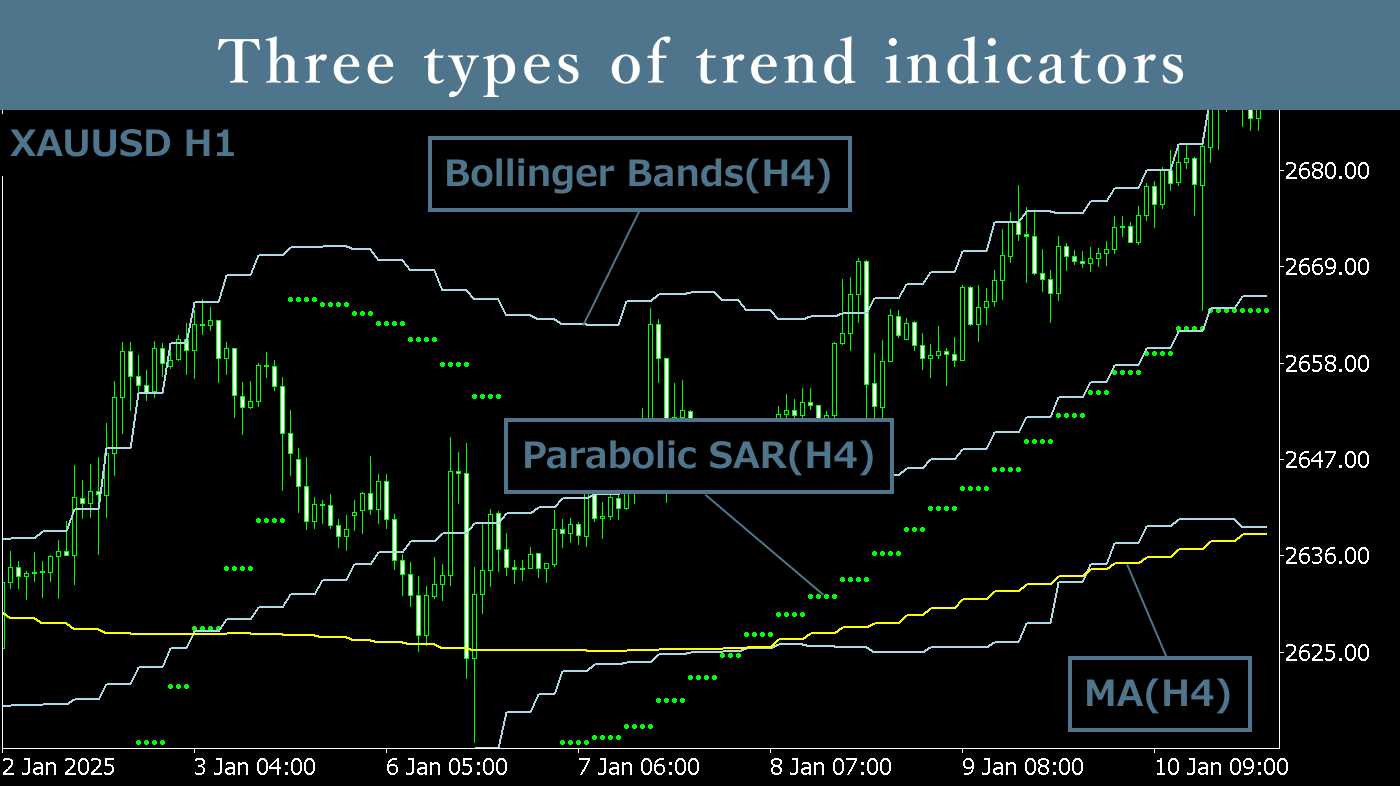
By referencing technical indicators from higher timeframes, you can evaluate how long a trend may continue or whether a reversal is likely. For example, if Bollinger Bands start expanding, it could indicate a strengthening trend. Similarly, if the Parabolic SAR reverses, it may signal a potential trend change. This approach enables a more comprehensive evaluation of market conditions.
 Download
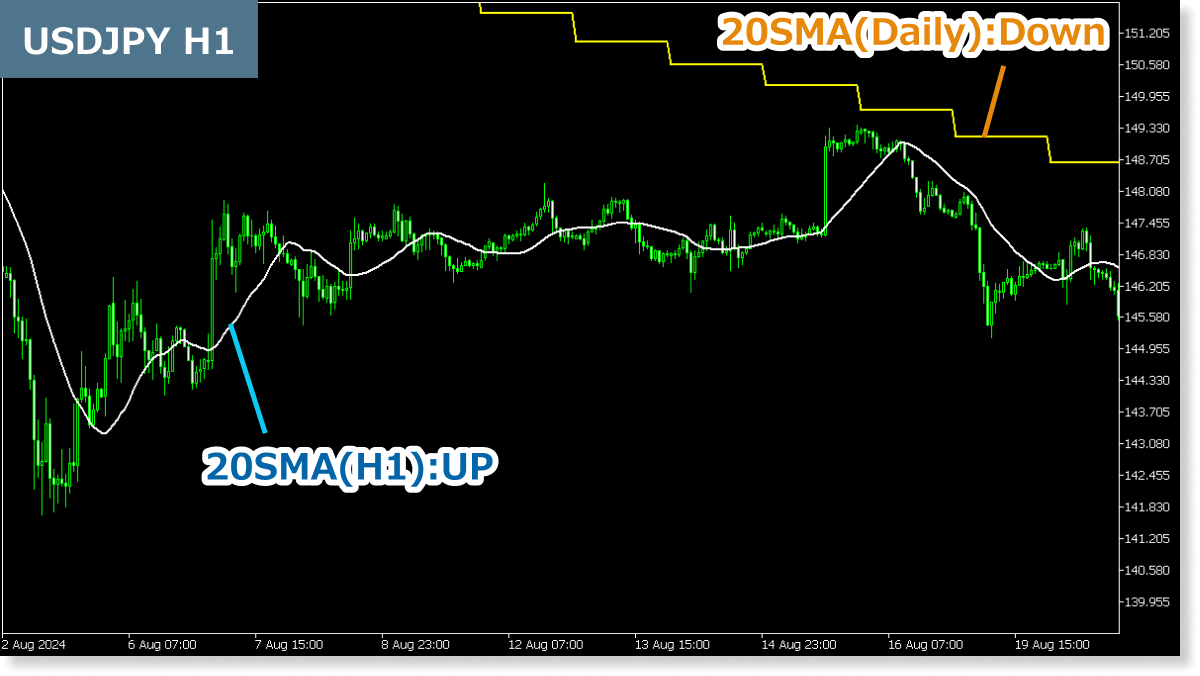
Using as a filter to decide whether to trade
One way to use this indicator is to avoid unnecessary risks by refraining from trading when higher timeframe technical indicators show a trend direction different from the current chart’s timeframe.
Combine with Higher Timeframe Indicator (Oscillators)
Use this indicator alongside FXON’s Higher Timeframe Indicator (Oscillators) to display MACD, RSI, Stochastics, and up to three additional technical indicators from higher timeframes, all on a single chart.
To view MACD, RSI, and Stochastics at the same time, apply the Higher Timeframe Indicator (Oscillators) twice.

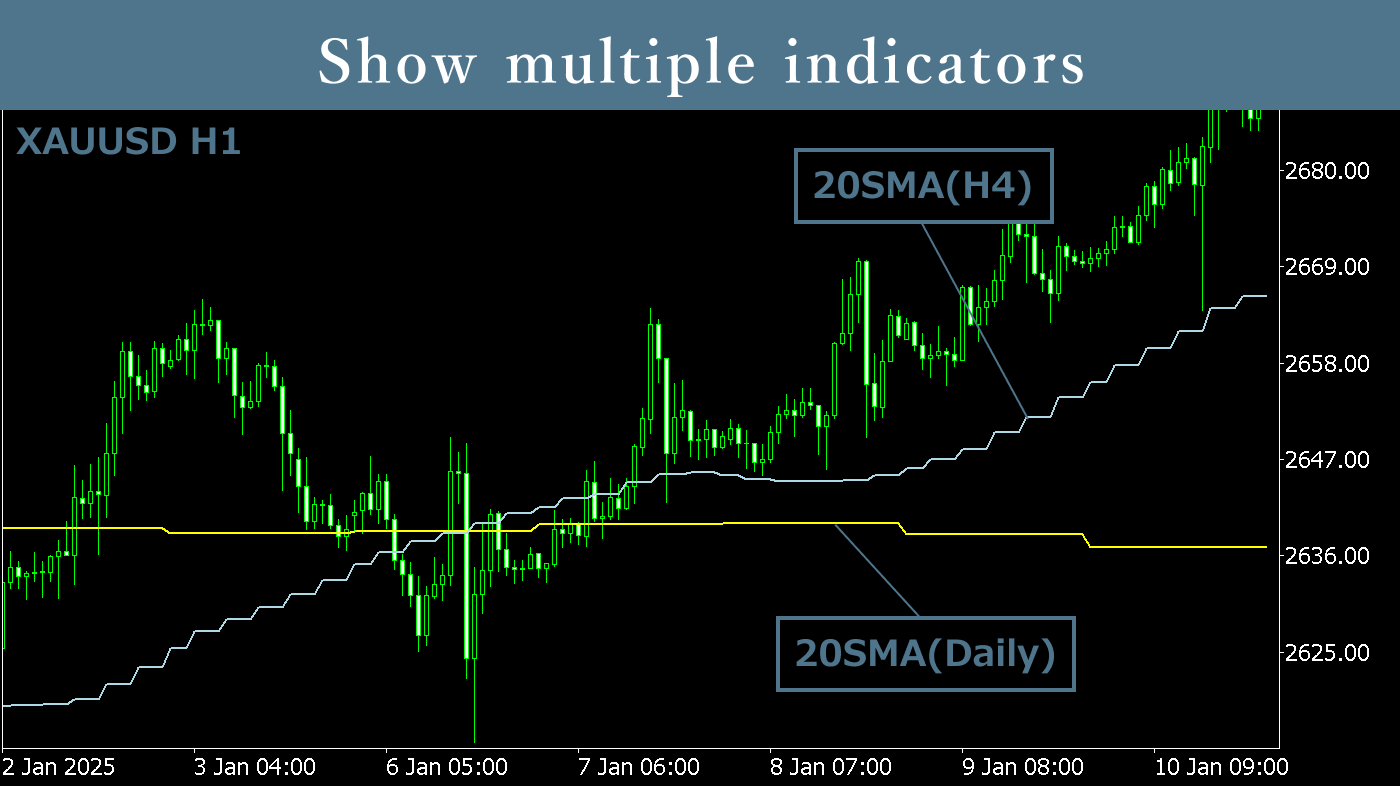
The appeal of the Higher Timeframe Indicator lies in its ability to directly display multiple technical indicators calculated from higher timeframes on your current chart. It reduces the hassle of switching between multiple timeframes, allowing you to easily grasp long-term trends at a glance while searching for entry points.
How to install
To use the Higher Timeframe Indicator (Trend Indicators), follow the steps below to download and install it.
Step 1
Click the button below to download the indicator for MT4/MT5.
Step 2
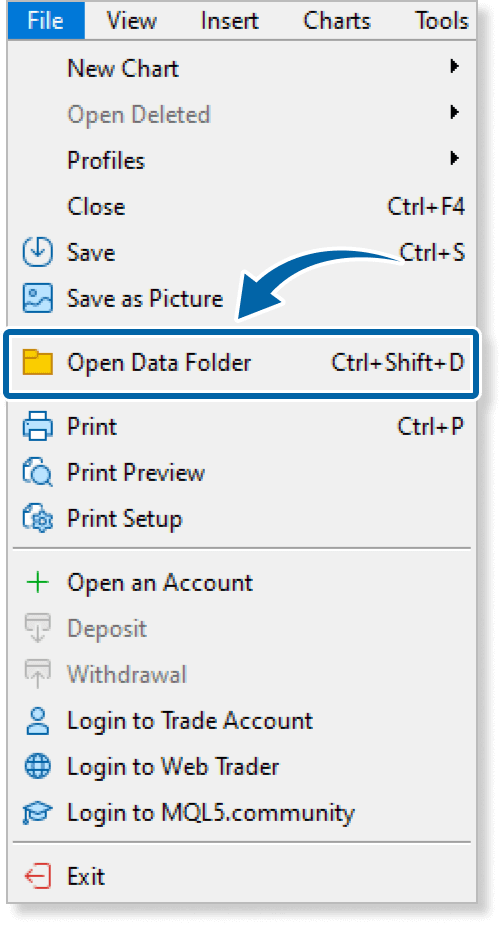
Click File > Open Data Folder in the top menu of MT4/MT5.
Step 3
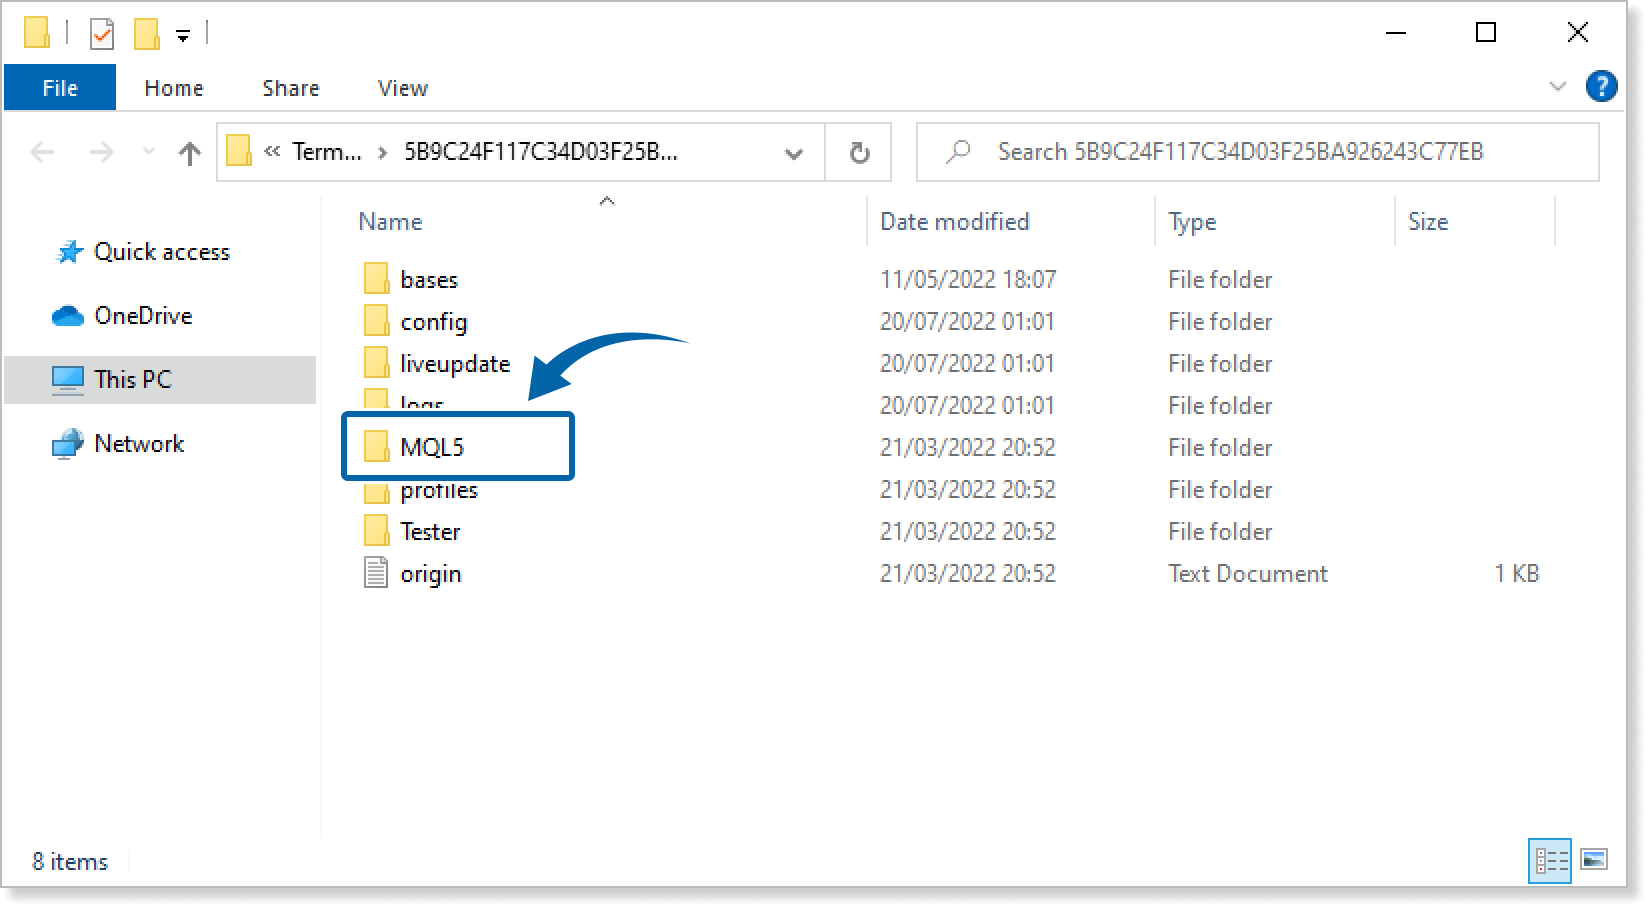
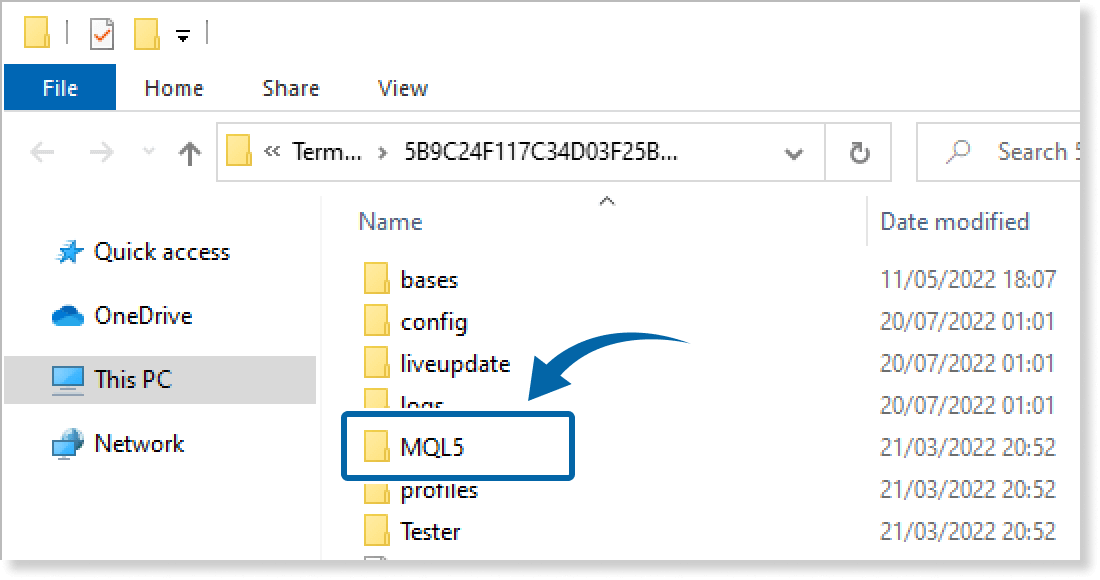
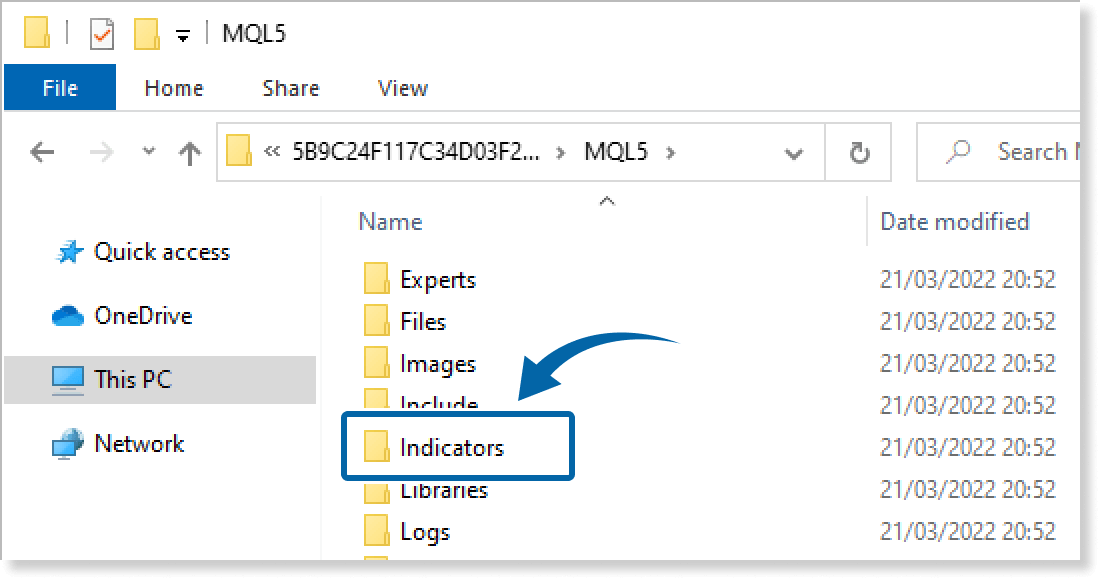
In the data folder, double-click the MQL4 or MQL5 folder.
Step 4
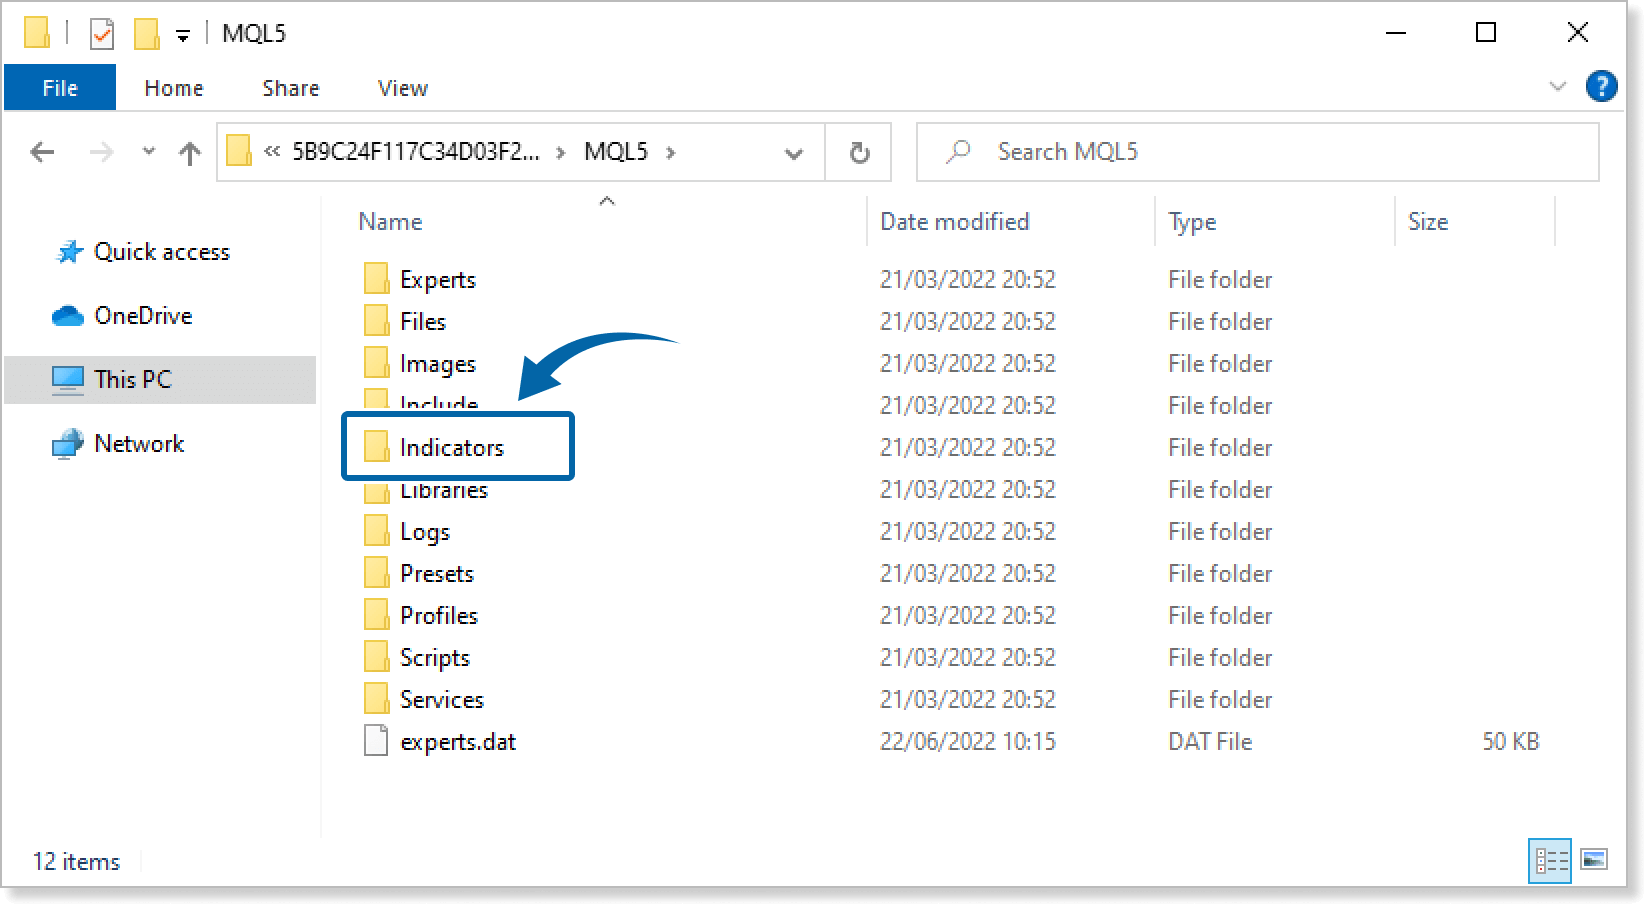
In the MQL4/MQL5 folder, double-click the Indicators folder.
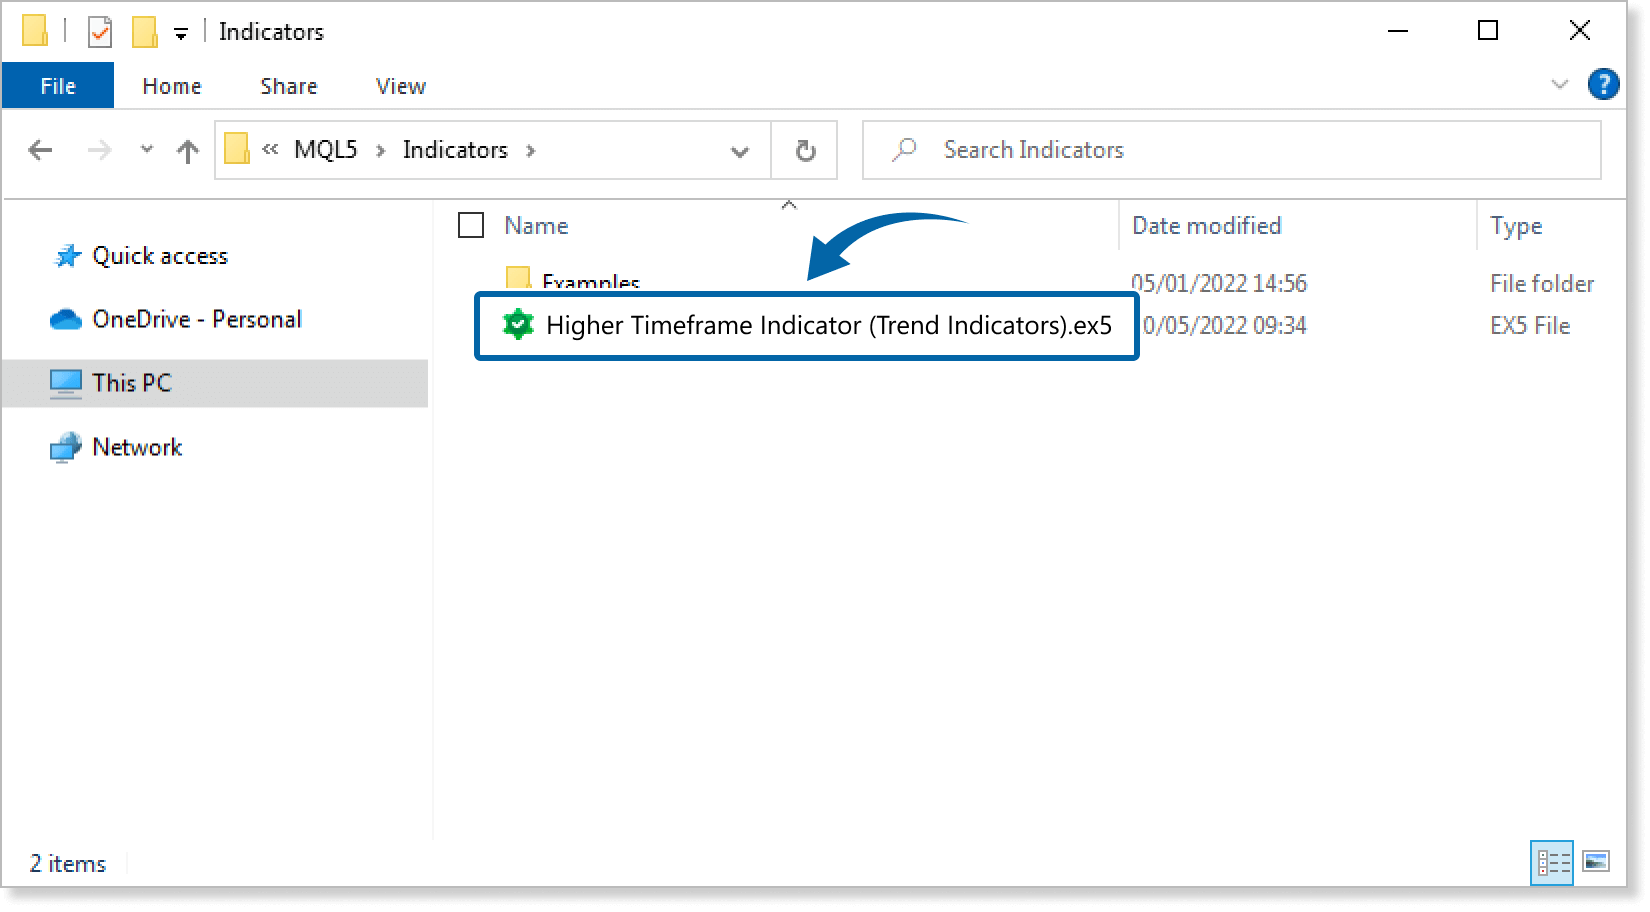
Step 5
Save the Higher Timeframe Indicator (Trend Indicators) in the Indicators folder.
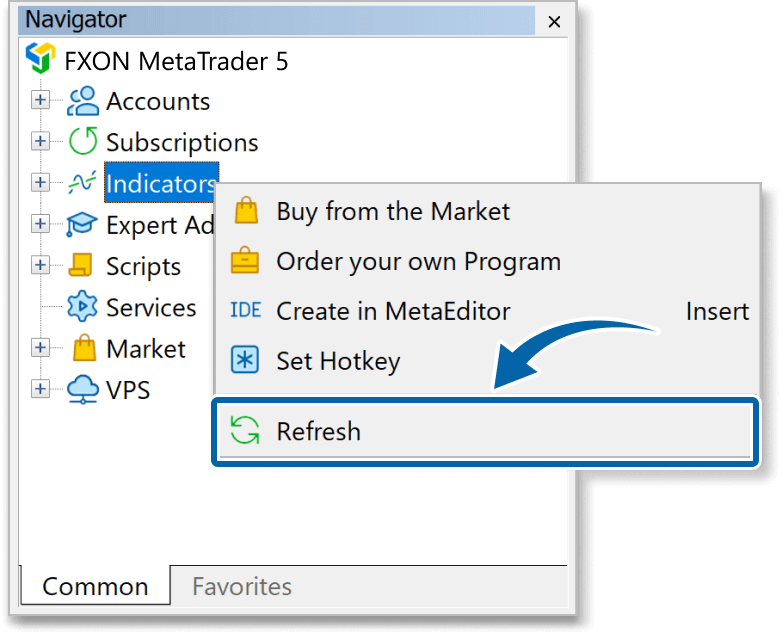
Step 6
Go back to the MT4/MT5. Right-click Indicators in the Navigator, and click Refresh.
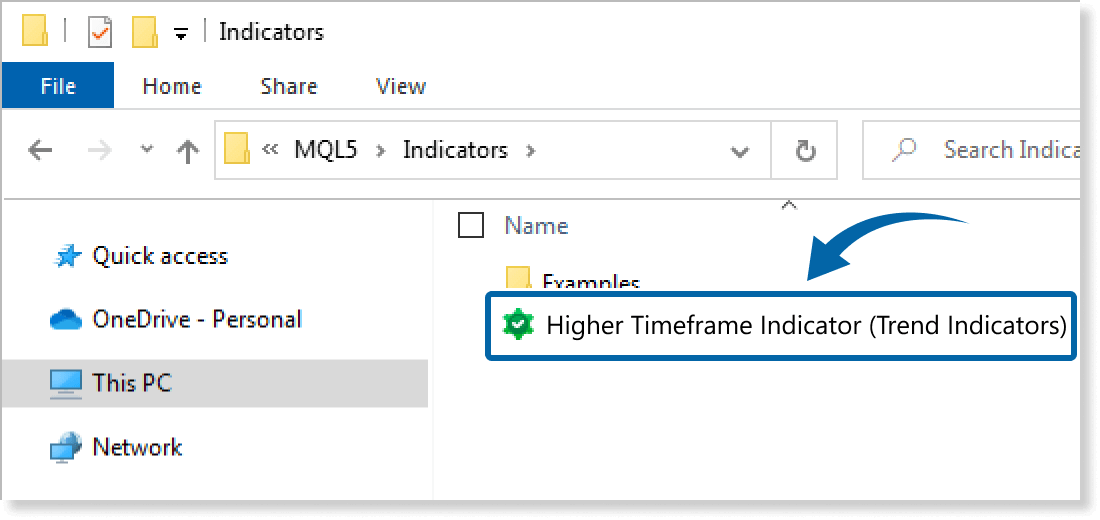
Step 7
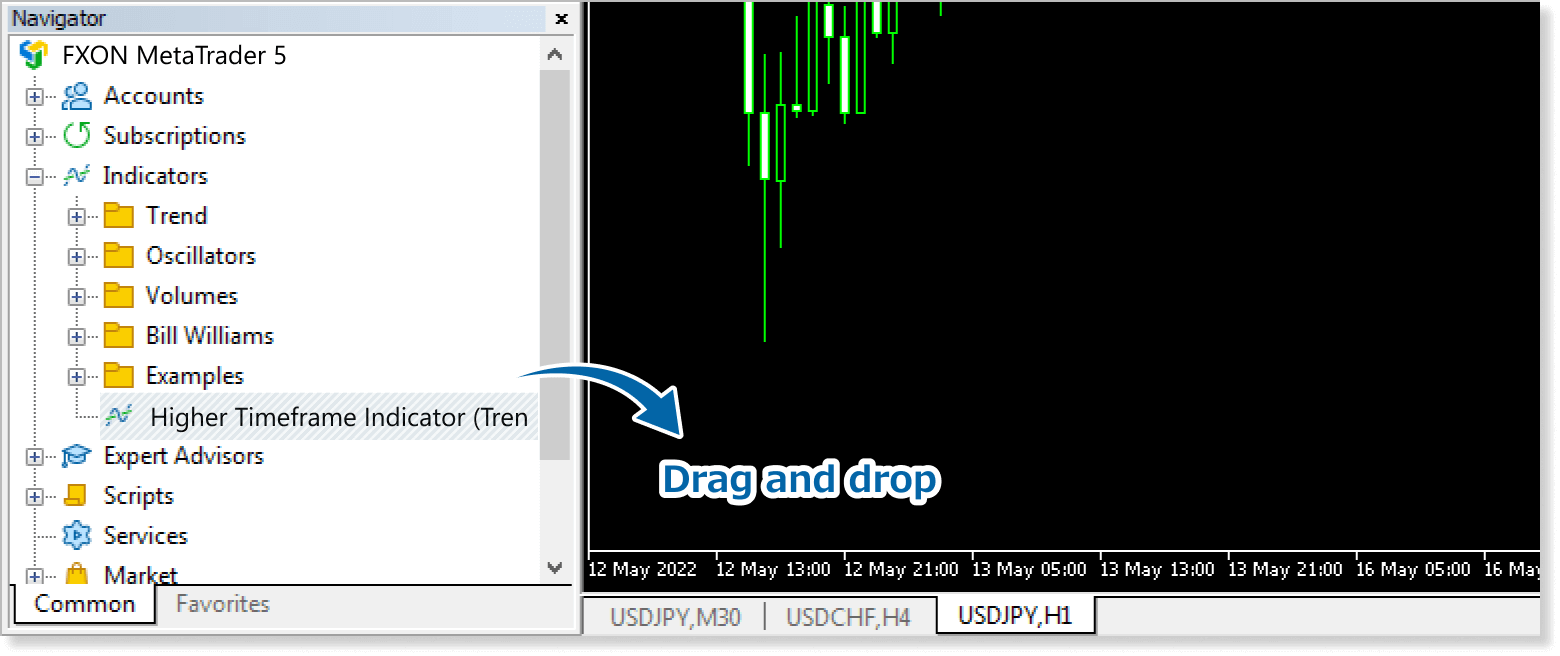
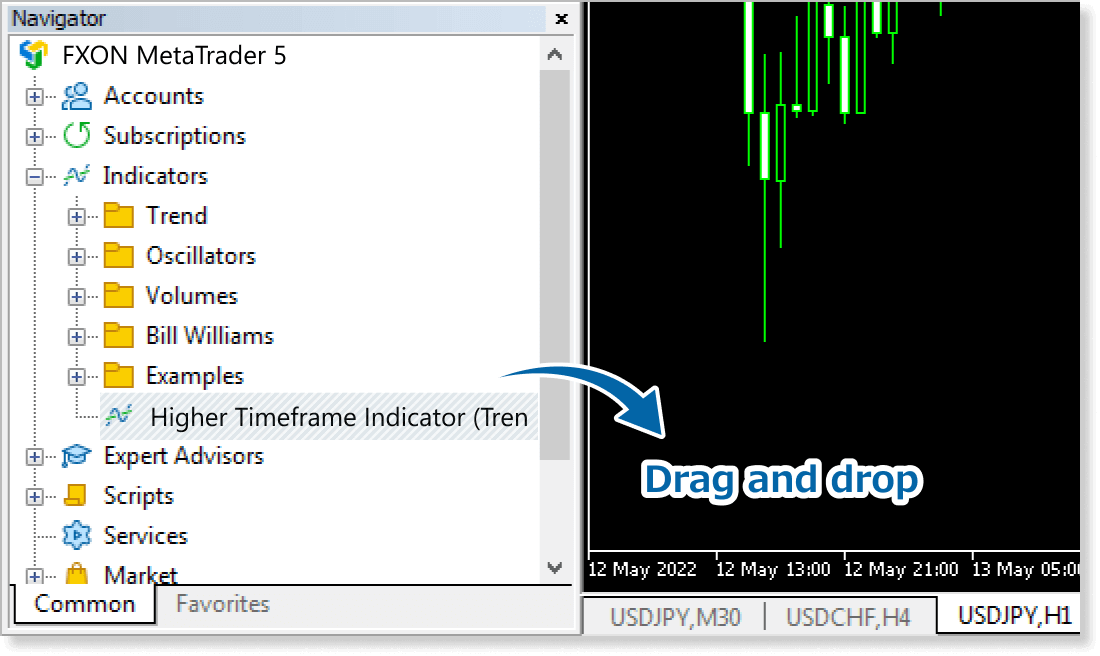
In the Navigator, click the + icon next to Indicators. Find the Higher Timeframe Indicator (Trend Indicators), then either double-click it or drag it onto a chart.
Step 8
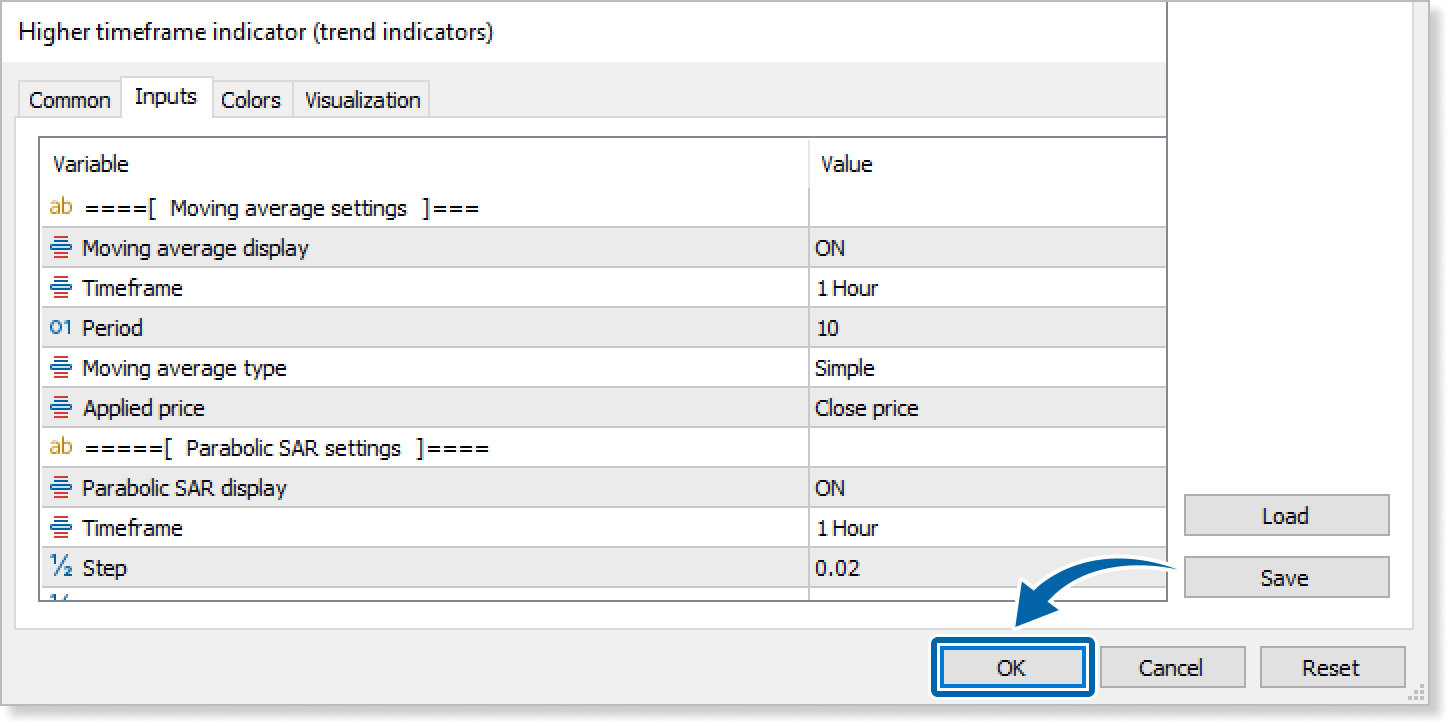
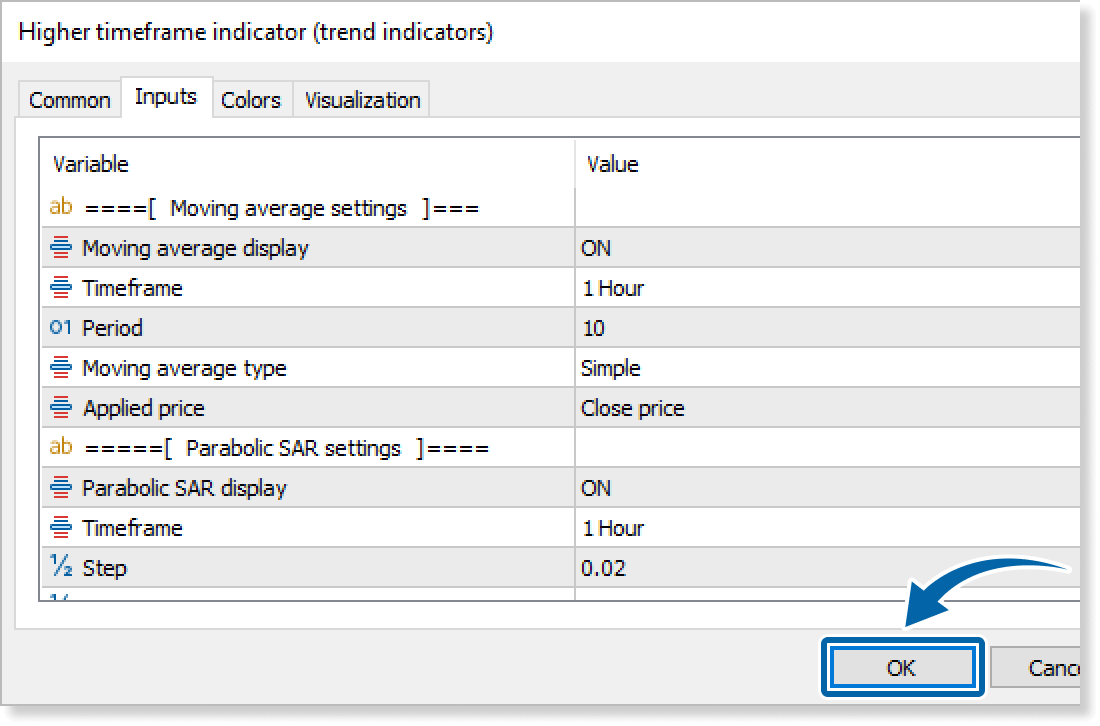
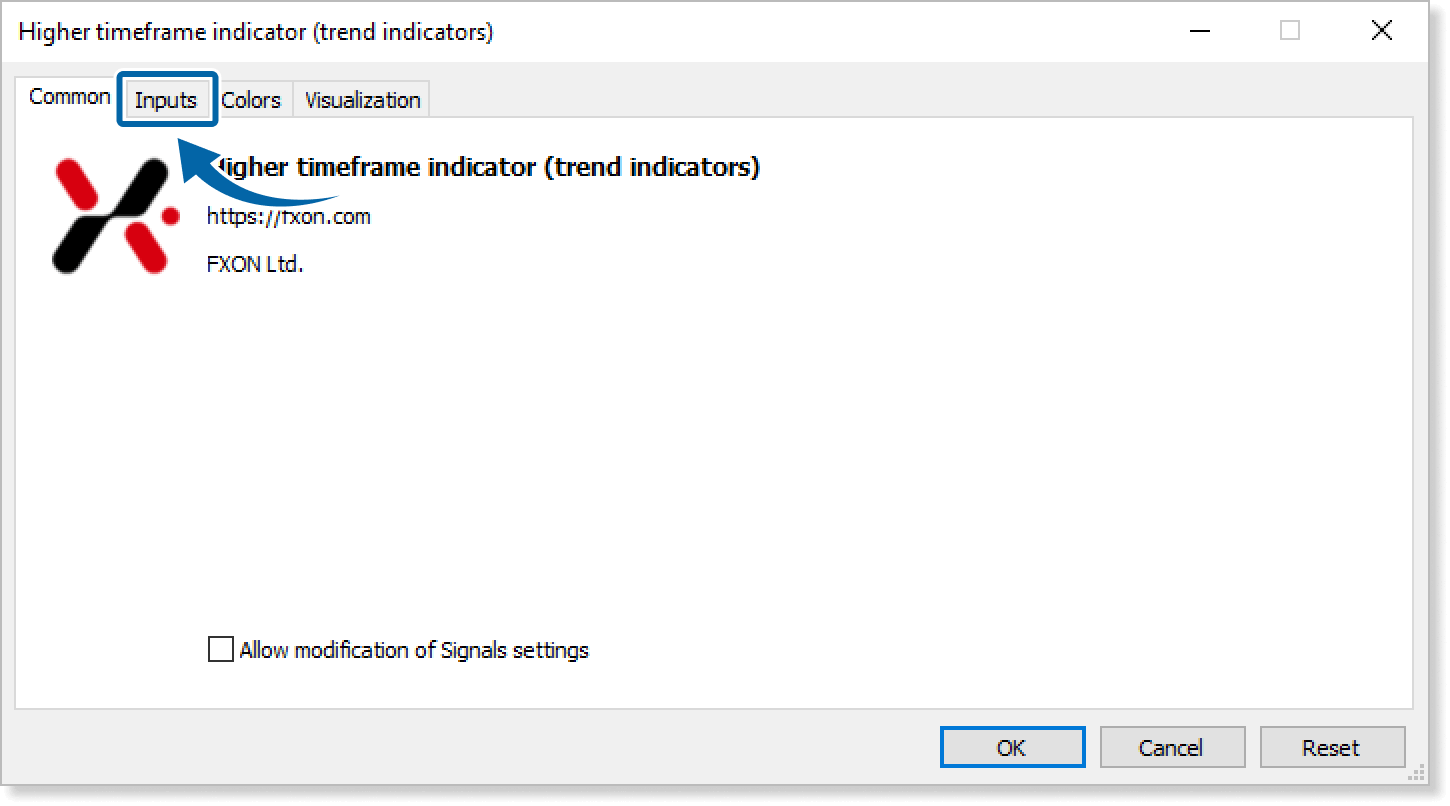
In the indicator settings window, customize the settings on the Inputs tab according to the How to set up page, then click OK.
Step 9
The Higher Timeframe Indicator (Trend Indicators) is applied to the chart and the technical indicators will be displayed.
How to set up
After applying the indicator to the chart, set the parameters according to your style.
Step 1
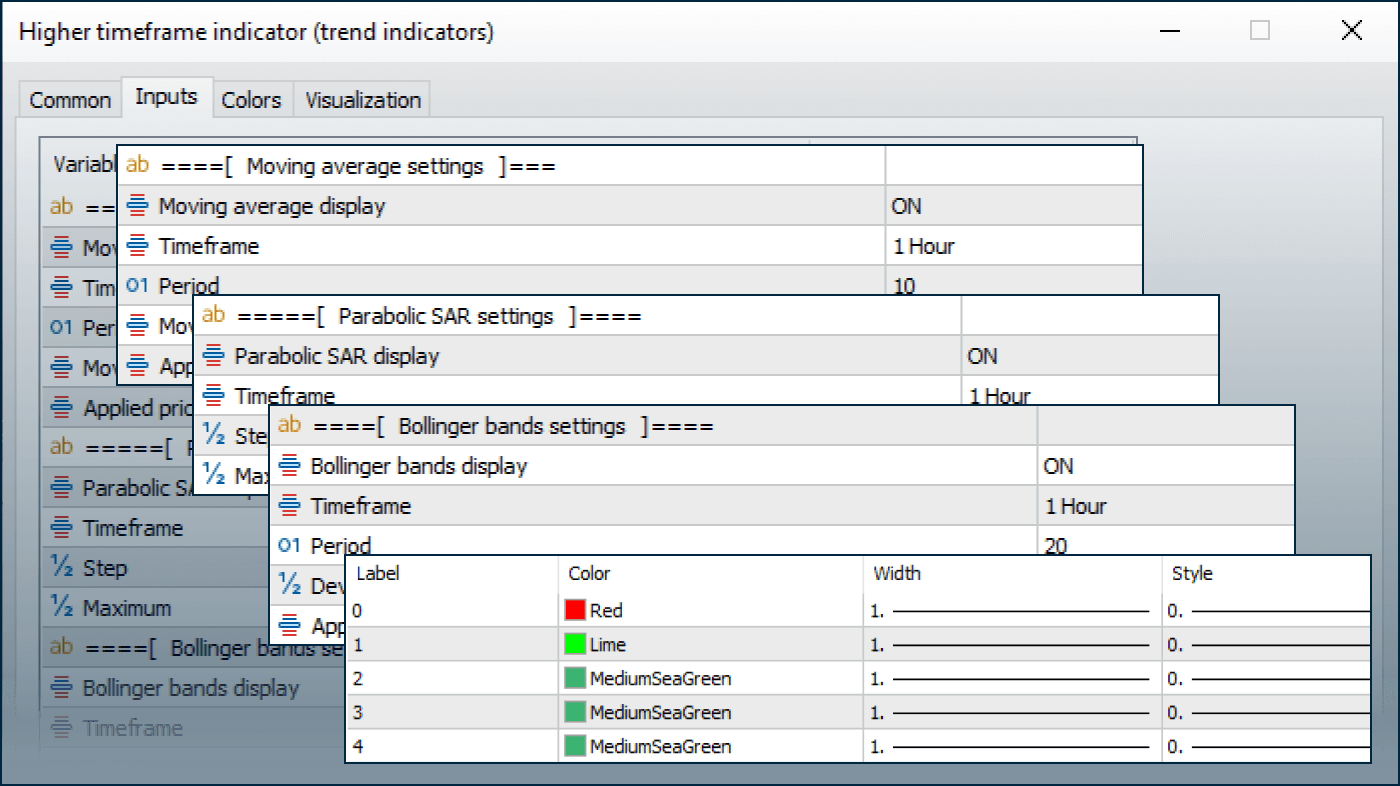
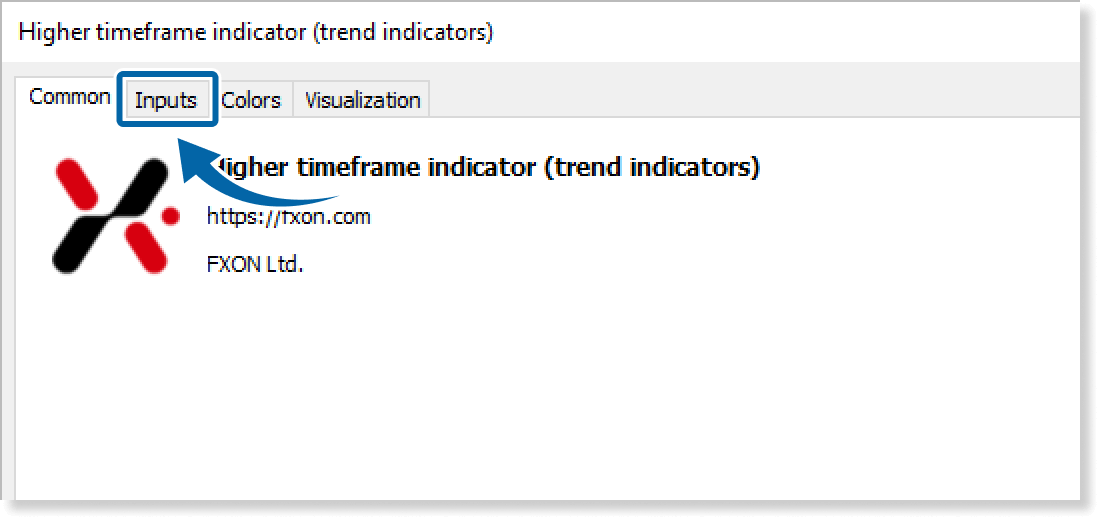
First, open the Inputs tab.
Step 2
Set the parameters as follows.
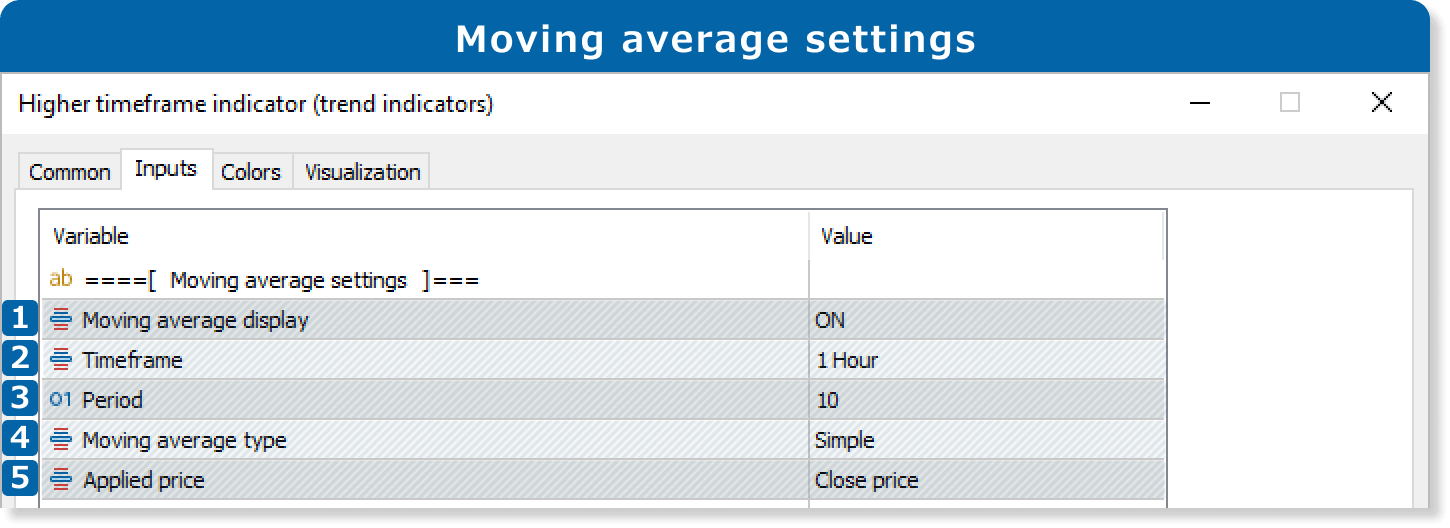
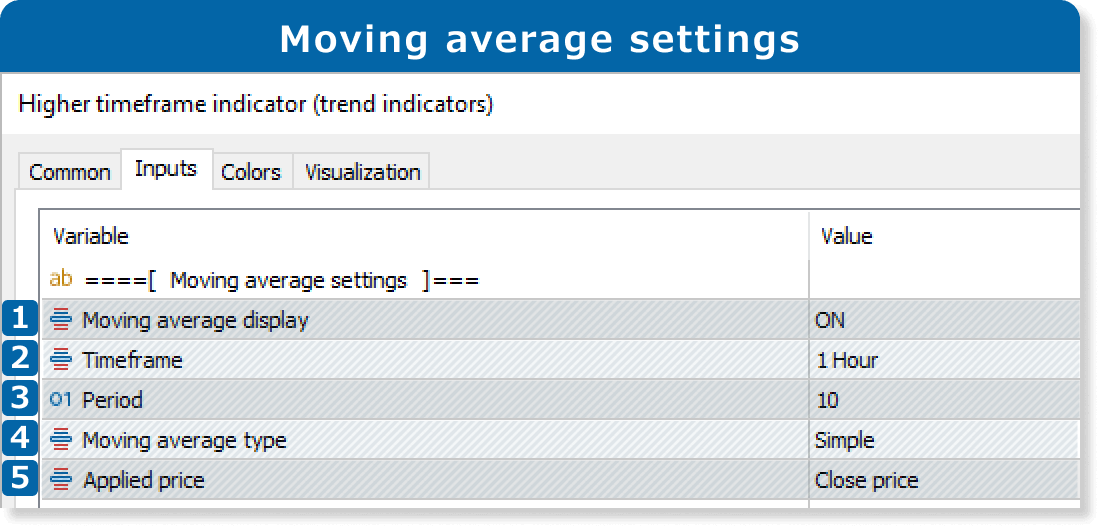
①Moving average
Select ON or OFF to display or hide moving average.
②Timeframe
Select the timeframe for the moving average to be displayed. If you select "current," it will be the same as the current chart.
③Period
Set the calculation period for the moving average.
④Moving average type
Select the type of moving average to display.
Simple: simple moving average
Exponential: exponential moving average
Smoothed: smoothed moving average
Linear Weighted: linear weighted moving average
⑤Applied price
Select the price to use for moving average calculation.
Close price
Open price
High price
Low price
Median price: (high price + low price) ÷2
Typical price: (high price + low price + close price) ÷3
Weighted price: (high price + low price + close price×2) ÷4
The Higher Timeframe Indicator (Trend Indicators) only displays technical indicators for the same or higher timeframe as the chart with the indicator. Data will be hidden if a lower timeframe is selected.
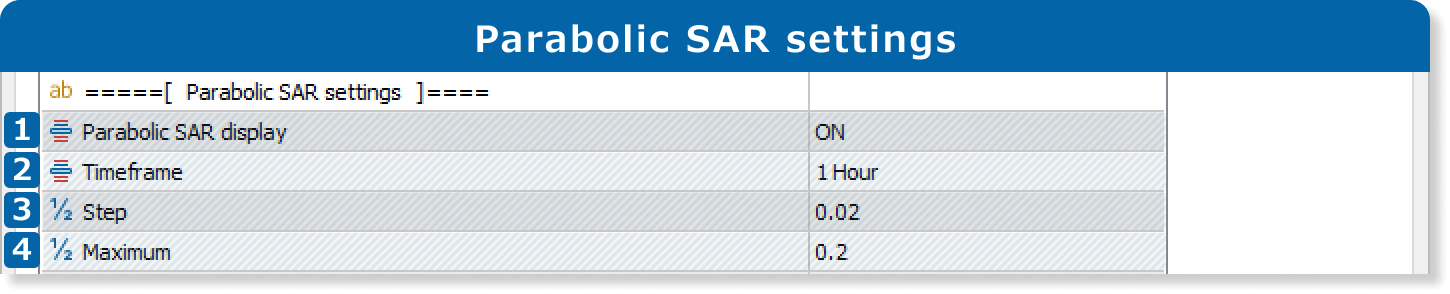
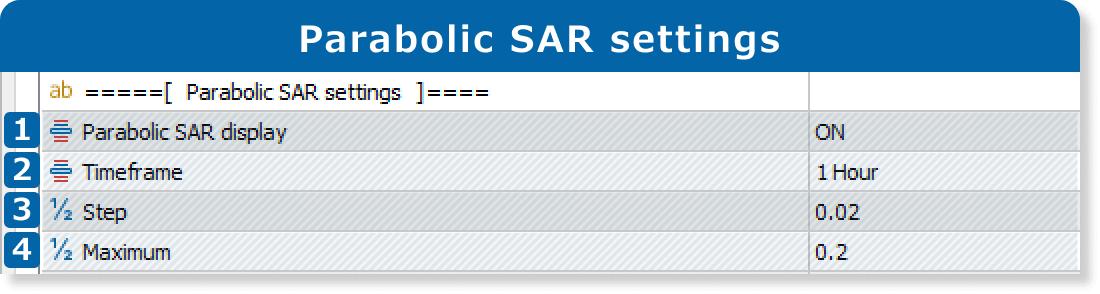
①Parabolic SAR display
Select ON or OFF to display or hide parabolic SAR.
②Timeframe
Select the timeframe for the parabolic SAR to be displayed. If you select "current," it will be the same as the current chart.
③Step
Enter the step for the parabolic SAR.
④Maximum
Set the maximum acceleration factor for the parabolic SAR.
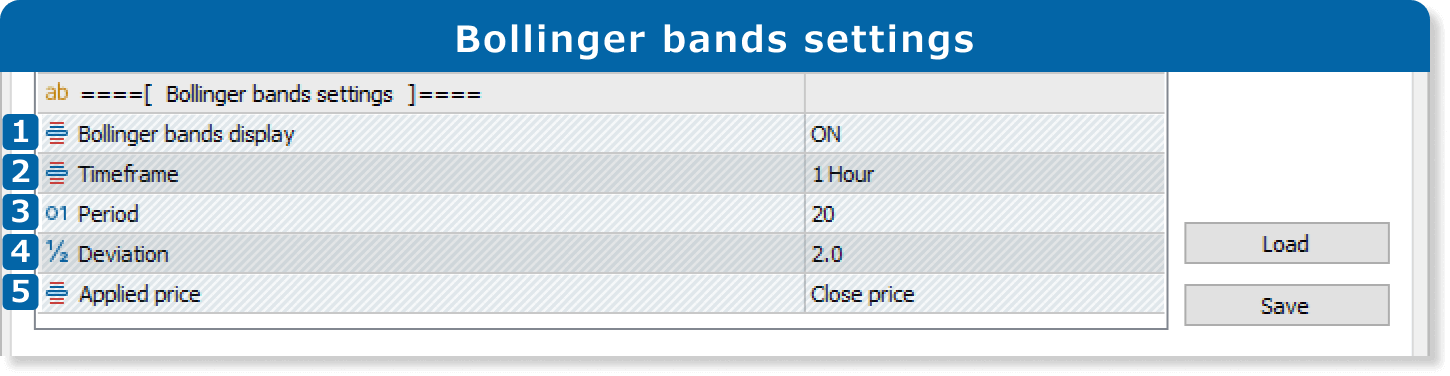
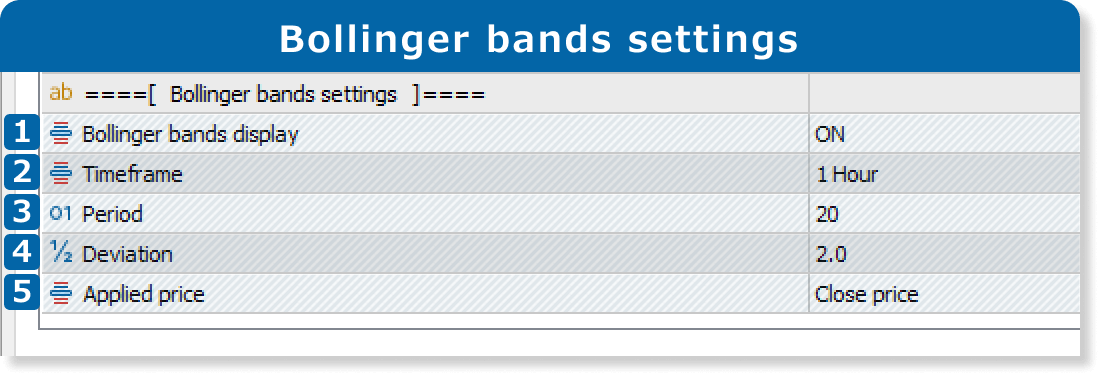
①Bollinger bands display
Select ON or OFF to display or hide Bollinger bands.
②Timeframe
Select the timeframe for the Bollinger bands to be displayed. If you select "current," it will be the same as the current chart.
③Period
Set the calculation period for the Bollinger bands.
④Deviation
Set the deviation for the Bollinger bands.
⑤Applied price
Select the price to use for Bollinger bands calculation.
Close price
Open price
High price
Low price
Median price: (high price + low price) ÷2
Typical price: (high price + low price + close price) ÷3
Weighted price: (high price + low price + close price×2) ÷4
Updates