


2025.08.07
This article was :
published
updated
Recap of previous trading day (August 6)
Yesterday the USDJPY moved up and down without clear direction in the 147-yen range, reaching a high of 147.88 around GMT 09:00, but then turned lower.
During New York trading hours, dovish comments from Fed officials strengthened expectations for early rate cuts, leading to increased dollar selling. Shortly after GMT 18:30 the pair hit a low of 146.97 before rebounding, and trading for the day closed at 147.36 yen.
Recap of the Tokyo market and outlook going forward
Today the USDJPY turned higher after hitting a low of 147.15 shortly after GMT 23:00 (on August 6), and as of GMT 04:00 is consolidating in the upper 147-yen range.
Looking at the 1-hour chart of the USDJPY (as of GMT 04:20 on August 7), it is fluctuating with a range at the 147-yen level, making it difficult to discern the direction. Based on the length of the upper wicks, selling pressure appears to have a slight edge, but it would be wise to wait for a clear break above recent highs or below recent lows.
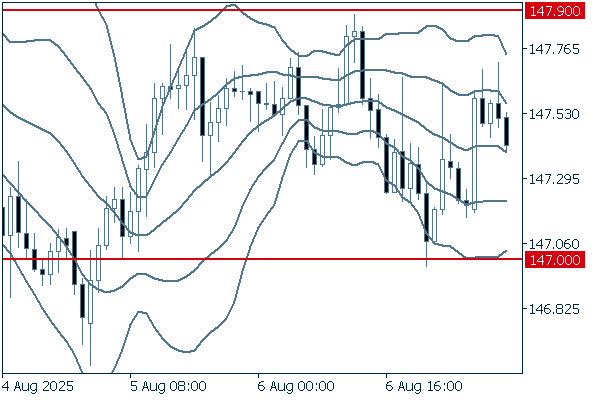
(20-period Bollinger Band, showing ±1 and ±2 standard deviations)
The main economic indicators for today are as follows:
- GMT 12:30 U.S. Initial jobless claims for the previous week
- GMT 12:30 U.S. Continuing jobless claims for the previous week
Don't miss trade opportunities with a 99.9% execution rate
Was this article helpful?
0 out of 0 people found this article helpful.
Thank you for your feedback.
Send