


2025.08.06
This article was :
published
updated
Recap of previous trading day (August 5)
Yesterday the USDJPY hit a low of 146.61 around GMT 00:00, then reversed higher and reached a high of 147.83 shortly after GMT 13:30.
The July ISM Services PMI released at GMT 14:00 came in with a poor result of 50.1 versus expectations of 51.5, causing a temporary pullback, but the pair found support in the lower 147-yen range and trading for the day closed at 147.59 yen.
Recap of the Tokyo market and outlook going forward
Today the USDJPY reached a high of 147.75 around GMT 02:00 but failed to extend gains, then hit a low of 147.30 around GMT 04:30, resulting in lackluster movement.
Looking at the 1-hour chart of the USDJPY (as of GMT 05:00 on August 6), the Bollinger Band width has narrowed and it is difficult to determine a clear direction. It seems that the best strategy here would be to move in the direction in which the price breaks: either the resistance line near 147.75 yen or the support line at 147.30 yen.
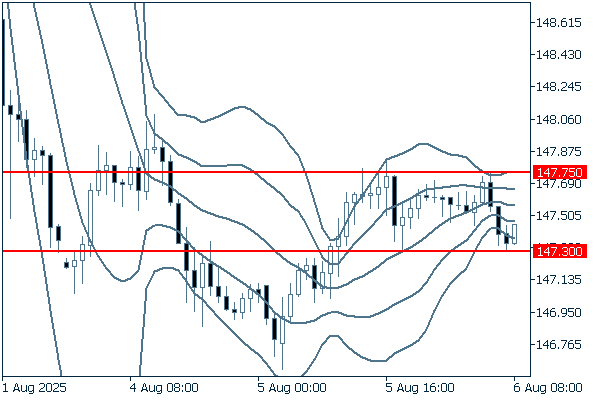
(20-period Bollinger Band, showing ±1 and ±2 standard deviations)
Today, no closely watched economic indicators are scheduled for release.
Don't miss trade opportunities with a 99.9% execution rate
Was this article helpful?
0 out of 0 people found this article helpful.
Thank you for your feedback.
Send