


2025.07.21
This article was :
published
updated
Recap of previous trading day (July 18)
On Friday of last week the USDJPY rebounded after dollar selling triggered by FRB Governor Christopher Waller's comments supporting rate cuts in July, reaching a high of 148.88 shortly after GMT 07:30. However, the upside proved heavy and the price turned lower, hitting a low of 148.18 around GMT 14:00 before recovering to 148.77 where trading closed for the week.
Recap of the Tokyo market and outlook going forward
Today the USDJPY gapped down at the open to 148.19 yen. The price reached a high of 148.66 directly after the opening but the recovery was weak, and as of GMT 05:00 it is trading weakly in the lower 148-yen range.
Looking at the 1-hour chart of the USDJPY (as of GMT 05:00 on July 21), it is difficult to determine a clear direction, but selling pressure is somewhat dominant with the pair trading below the middle line. If the pair breaks below the -2 standard deviations level and continues declining, adopting a short-term bearish stance could prove effective.
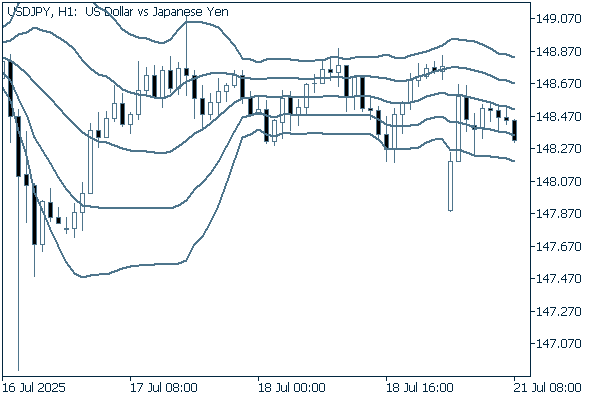
(20-period Bollinger Band, showing ±1 and ±2 standard deviations)
The main economic indicators for today are as follows:
- GMT 14:00 U.S. June Leading Index
Don't miss trade opportunities with a 99.9% execution rate
Was this article helpful?
0 out of 0 people found this article helpful.
Thank you for your feedback.
Send