


2025.04.08
This article was :
published
updated
Recap of previous trading day (April 7)
Yesterday the USDJPY generally moved steadily after reaching a low of 144.81 yen shortly after GMT 23:00 (on April 6).
There were reports that President Trump was considering a 90-day suspension of tariff measures, which strengthened dollar buying. Although this was later revealed to be fake news, there was no significant decline, and the price reached a high of 148.15 yen around GMT 17:00. Trading for the day closed at 147.81 yen.
Recap of the Tokyo market and outlook going forward
Today the USDJPY touched a high of 148.12 yen around GMT 22:30 (on April 7) before gradually turning downward, reaching 147.25 yen around GMT 02:30. As of GMT 04:30, it is trading in the mid-147-yen range.
Looking at the 1-hour chart of the USDJPY (as of GMT 04:40 on April 8), if the price clearly breaks above the resistance line near 148.15 yen, it could aim for the 150-yen range, but if it clearly breaks below 147.30 yen, an adjustment to the low 146-yen range is also possible. One sensible approach might be to follow the direction once it becomes clear.
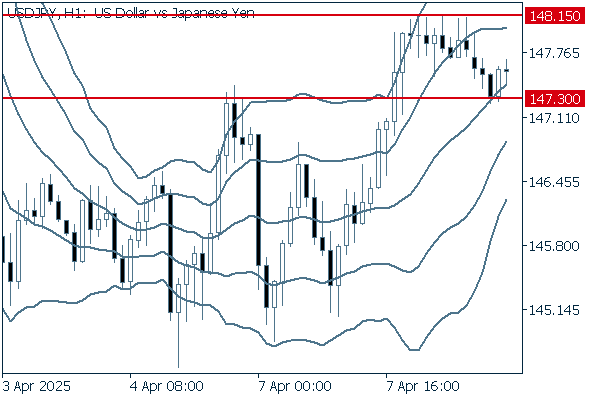
(20-period Bollinger Band, showing ±1 and ±2 standard deviations)
Today, no closely watched economic indicators are scheduled for release.
Was this article helpful?
0 out of 0 people found this article helpful.
Thank you for your feedback.
Send