


2025.04.07
This article was :
published
updated
Recap of previous trading day (April 4)
On Friday of last week the USDJPY saw downward momentum strengthen shortly after GMT 09:30, reaching a low of 144.55 yen around GMT 11:00. Subsequently, dollar buybacks entered the market and the pair reached a high of 147.43 yen around GMT 18:00. Trading for the week closed at 146.92 yen.
Recap of the Tokyo market and outlook going forward
The USDJPY started this week with a large downward gap. There was risk-averse yen buying after U.S. Treasury Secretary Scott Bessent showed a positive attitude toward tariffs over the weekend. The USDJPY touched a low of 144.81 shortly after GMT 23:00 (on April 6), then rebounded to reach a high of 146.84 shortly after GMT 02:30, and as of GMT 04:00 is moving in the lower half of the 146-yen range.
Looking at the 1-hour chart of the USDJPY (as of GMT 04:00 on April 7), the movement has stabilized after the sharp decline, with range-bound trading continuing around the middle line. The market lacks directional bias, and attention is likely to focus on the next breakout direction.
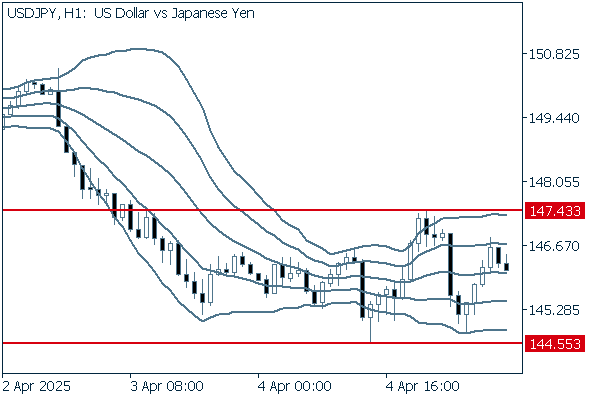
(20-period Bollinger Band, showing ±1 and ±2 standard deviations)
Today, no closely watched economic indicators are scheduled for release.
Was this article helpful?
0 out of 0 people found this article helpful.
Thank you for your feedback.
Send