


2025.01.29
This article was :
published
updated
Recap of previous trading day (January 28)
Yesterday the USDJPY showed strength directly after the open, reaching a high of 155.97 shortly after GMT 08:30, but pulled back before hitting 156. It touched 155.04 shortly after GMT 15:30 but did not break below 155, and trading for the day closed at 155.50.
Recap of the Tokyo market and outlook going forward
Today the USDJPY reached a high of 155.79 around GMT 01:00, then fell back to record a low of 155.32 shortly after GMT 03:30. Trading remains thin as markets await the FOMC outcome.
Looking at the 1-hour chart of the USDJPY (as of GMT 04:00 on January 29), the width of the Bollinger Bands has narrowed, with range-bound trading between around 155.2 and 156 yen. The approach here would be to move in the direction in which the price breaks.
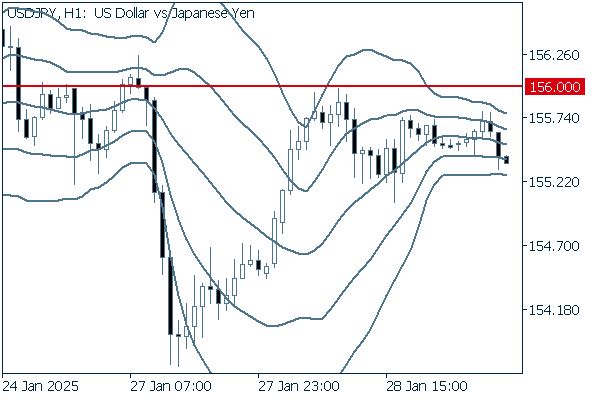
(20-period Bollinger Band, showing ±1 and ±2 standard deviations)
The main economic indicators for today are as follows:
- GMT 23:50 (January 28) Japan Bank of Japan Monetary Policy Meeting Minutes
- GMT 19:00 Announcement on interest rates after U.S. Federal Open Market Committee (FOMC) meeting
- GMT 19:30 U.S. Regular press conference with FRB Chairman Jerome Powell
Was this article helpful?
0 out of 0 people found this article helpful.
Thank you for your feedback.
Send